

Question: point(s) possible The graph to the right shows the number of cities with certain average annual snowfall amounts (in inches). Identify the level of
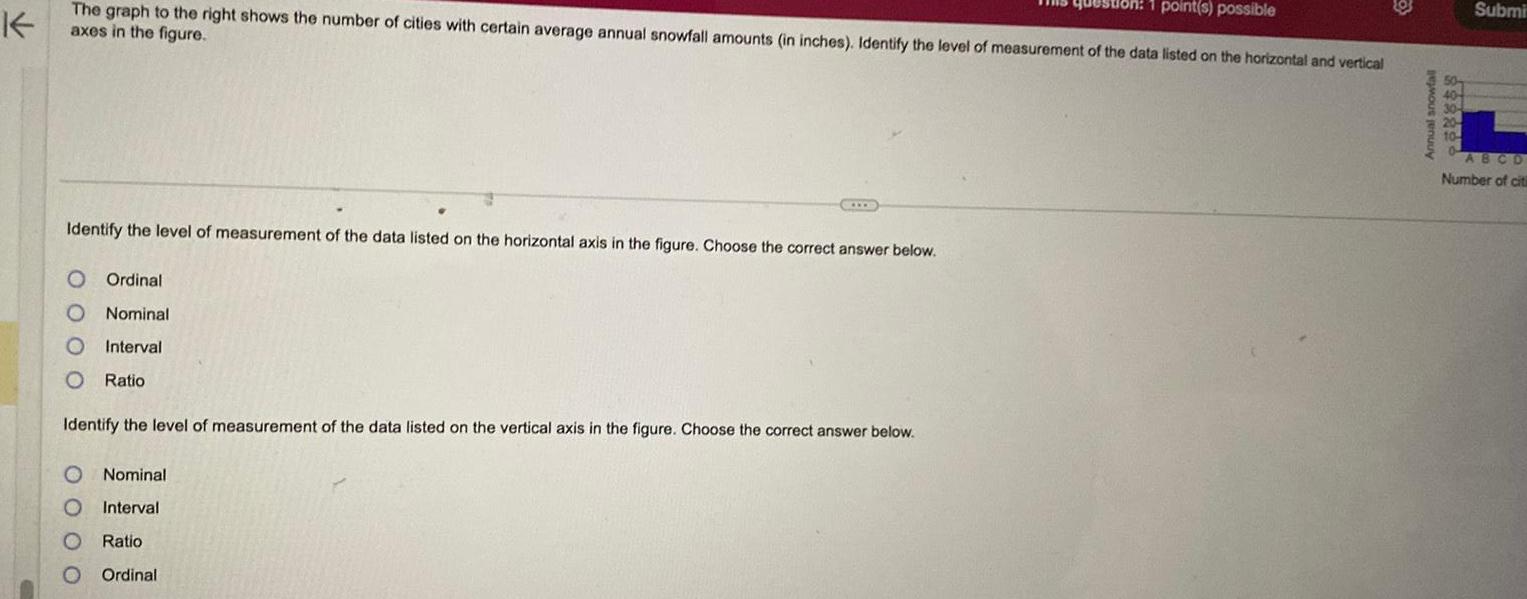
point(s) possible The graph to the right shows the number of cities with certain average annual snowfall amounts (in inches). Identify the level of measurement of the data listed on the horizontal and vertical axes in the figure. Identify the level of measurement of the data listed on the horizontal axis in the figure. Choose the correct answer below. O Ordinal O Nominal O Interval O Ratio Identify the level of measurement of the data listed on the vertical axis in the figure. Choose the correct answer below. O Nominal O Interval O Ratio O Ordinal S Submi 40- 30- 20- 10 ABCD Number of cit
Step by Step Solution
There are 3 Steps involved in it

Get step-by-step solutions from verified subject matter experts