

Question: Polynomial functions Polynomial functions can be used to model a wide variety of occurrences in science, in business, and in everyday life. Use www.desmos.com/calculator to
Polynomial functions
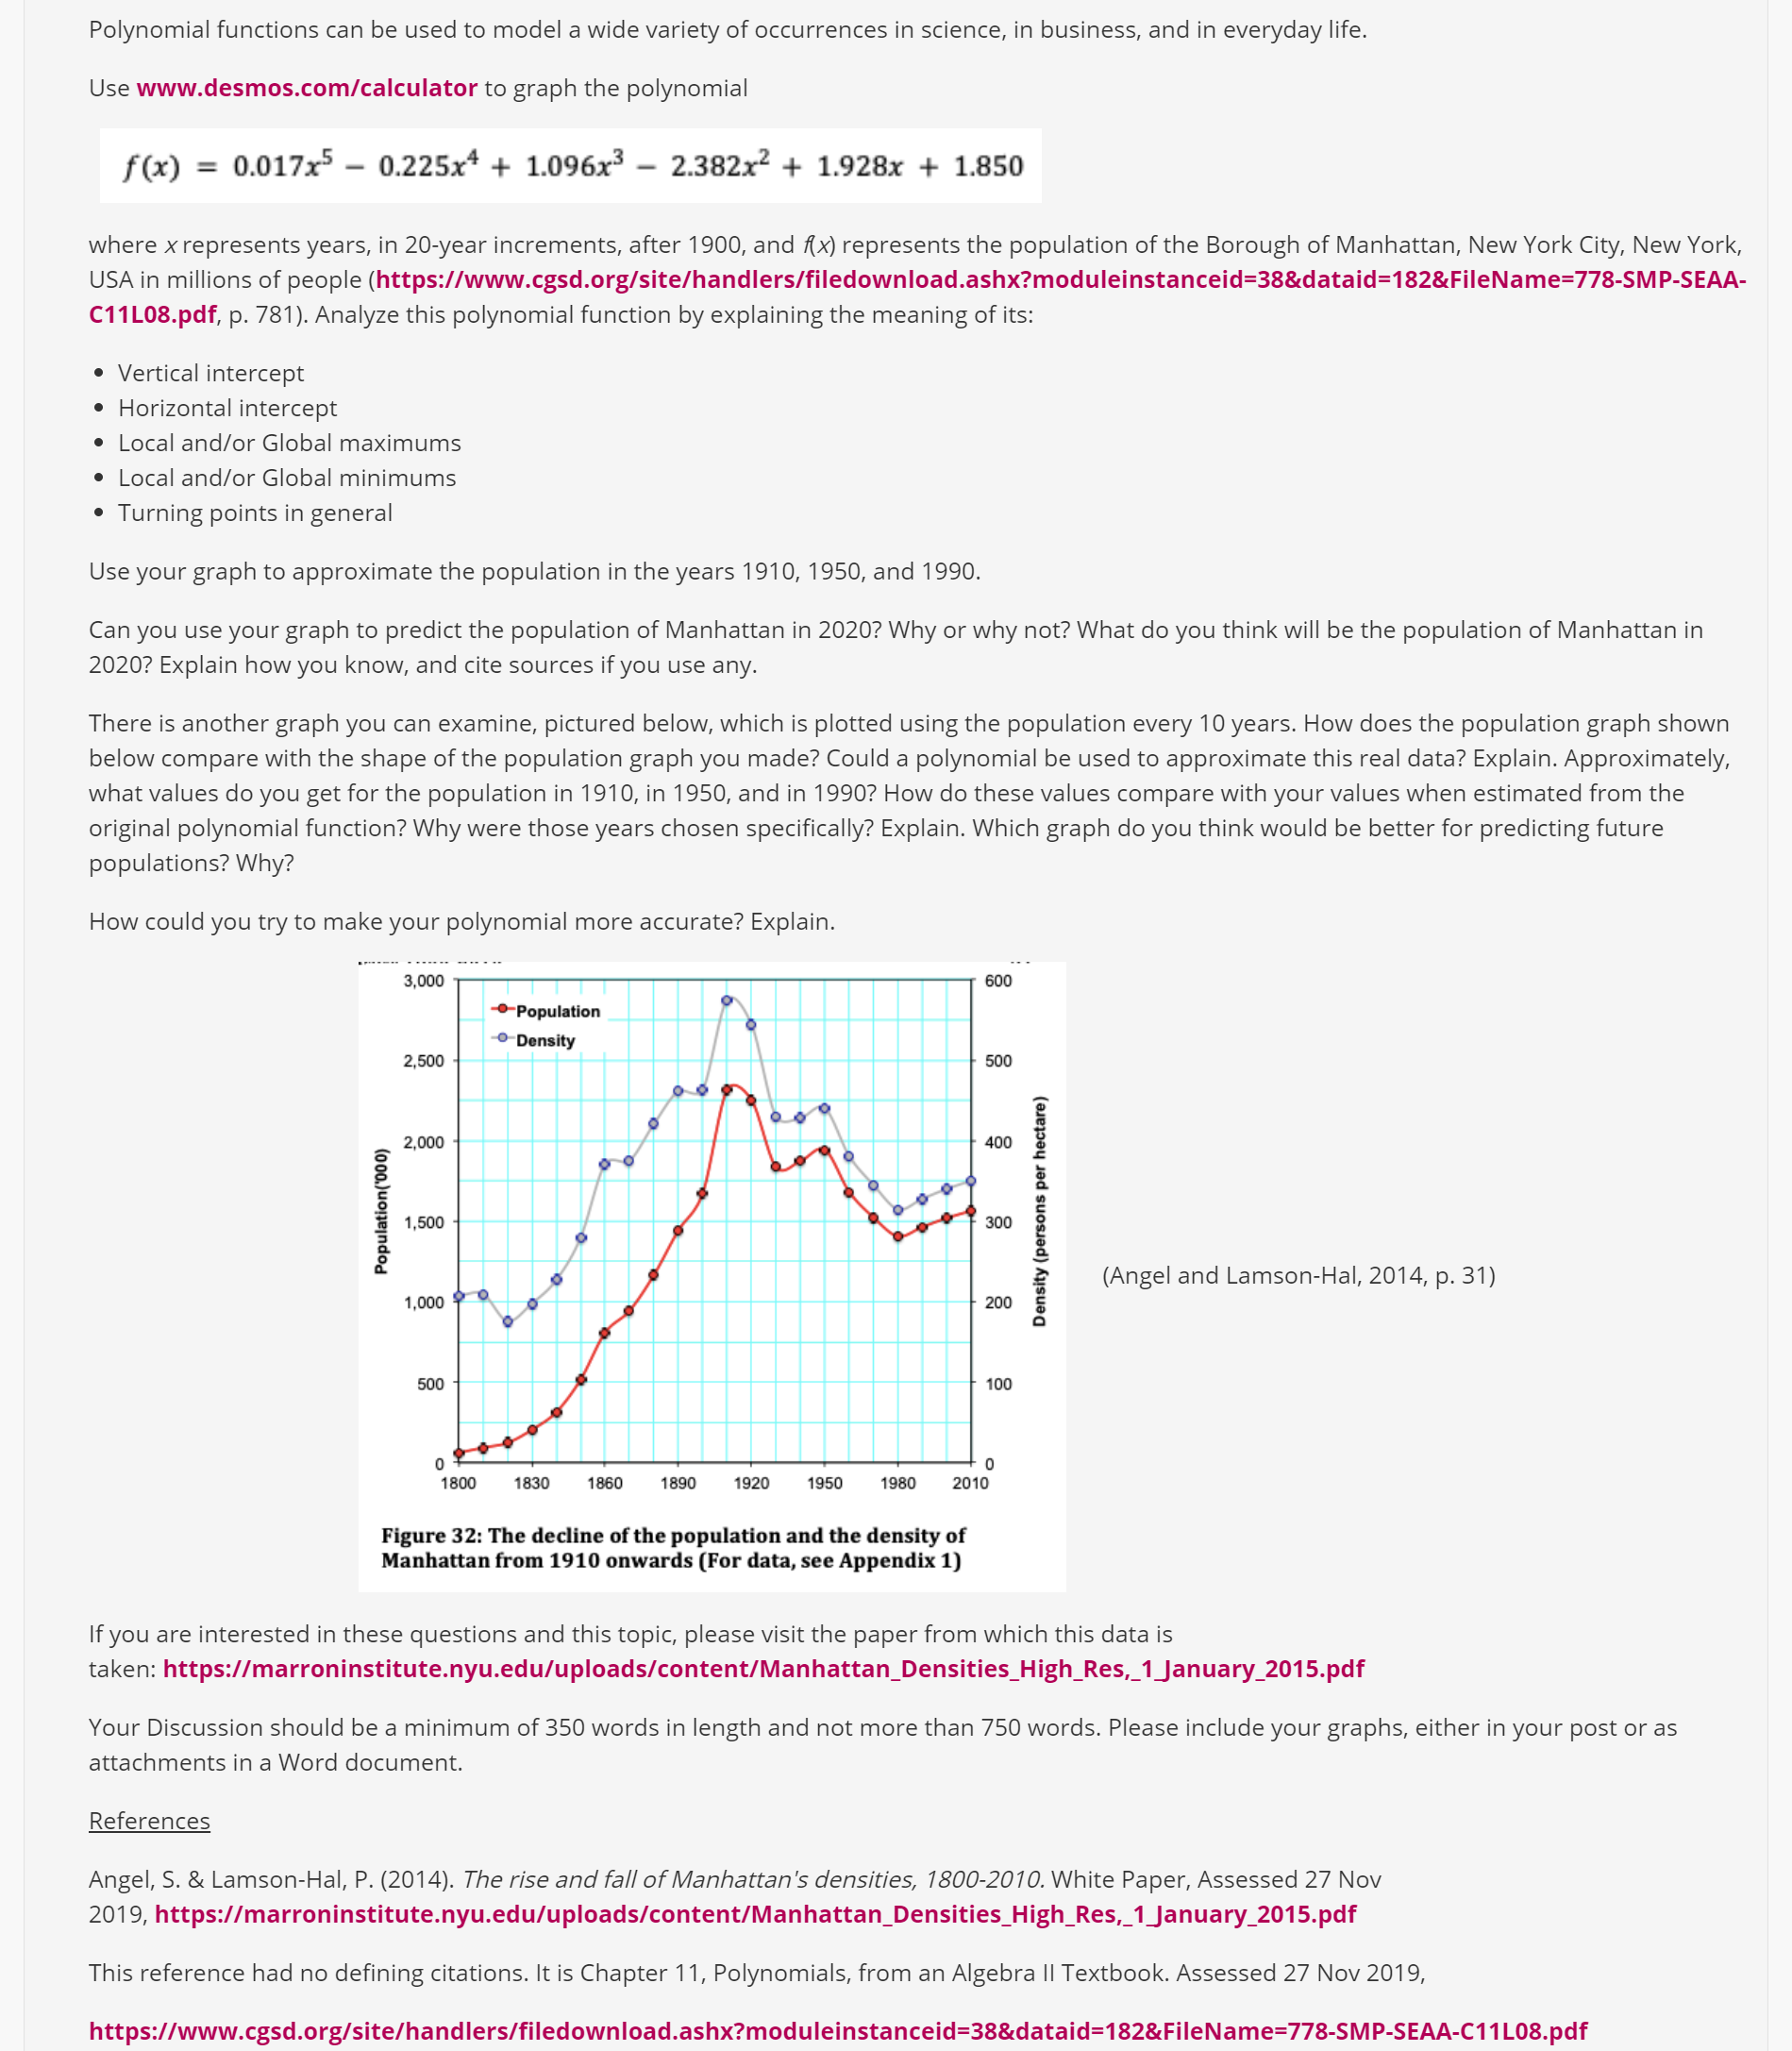
Polynomial functions can be used to model a wide variety of occurrences in science, in business, and in everyday life. Use www.desmos.com/calculator to graph the polynomial f(x) = 0.017x5 - 0.225x4 + 1.096x3 - 2.382x2 + 1.928x + 1.850 where x represents years, in 20-year increments, after 1900, and f(x) represents the population of the Borough of Manhattan, New York City, New York, JSA in millions of people (https://www.cgsd.org/site/handlers/filedownload.ashx?moduleinstanceid=38&dataid=182&FileName=778-SMP-SEAA- C11L08.pdf, p. 781). Analyze this polynomial function by explaining the meaning of its: . Vertical intercept . Horizontal intercept Local and/or Global maximums . Local and/or Global minimums . Turning points in general Use your graph to approximate the population in the years 1910, 1950, and 1990. Can you use your graph to predict the population of Manhattan in 2020? Why or why not? What do you think will be the population of Manhattan in 2020? Explain how you know, and cite sources if you use any. There is another graph you can examine, pictured below, which is plotted using the population every 10 years. How does the population graph shown below compare with the shape of the population graph you made? Could a polynomial be used to approximate this real data? Explain. Approximately, what values do you get for the population in 1910, in 1950, and in 1990? How do these values compare with your values when estimated from the original polynomial function? Why were those years chosen specifically? Explain. Which graph do you think would be better for predicting future populations? Why? How could you try to make your polynomial more accurate? Explain. 3,000 600 -Population -Density 2,500 500 2,000 400 Population('00 0 1,500 300 1,000 200 Density (persons per hectare) (Angel and Lamson-Hal, 2014, p. 31) 500 100 1830 1860 1890 1920 1950 1980 2010 Figure 32: The decline of the population and the density of Manhattan from 1910 onwards (For data, see Appendix 1) If you are interested in these questions and this topic, please visit the paper from which this data is taken: https://marroninstitute.nyu.edu/uploads/content/Manhattan_Densities_High_Res,_1_January_2015.pdf Your Discussion should be a minimum of 350 words in length and not more than 750 words. Please include your graphs, either in your post or as attachments in a Word document. References Angel, S. & Lamson-Hal, P. (2014). The rise and fall of Manhattan's densities, 1800-2010. White Paper, Assessed 27 Nov 2019, https://marroninstitute.nyu.edu/uploads/content/Manhattan_Densities_High_Res,_1_January_2015.pdf This reference had no defining citations. It is Chapter 11, Polynomials, from an Algebra II Textbook. Assessed 27 Nov 2019, https://www.cgsd.org/site/handlers/filedownload.ashx?moduleinstanceid=38&dataid=182&FileName=778-SMP-SEAA-C11L08.pdf
Step by Step Solution
There are 3 Steps involved in it

Get step-by-step solutions from verified subject matter experts