

Question: polynomial functions Use the following information to answer the question. The table below shows the relationship between the speed of a particular car and the
polynomial functions
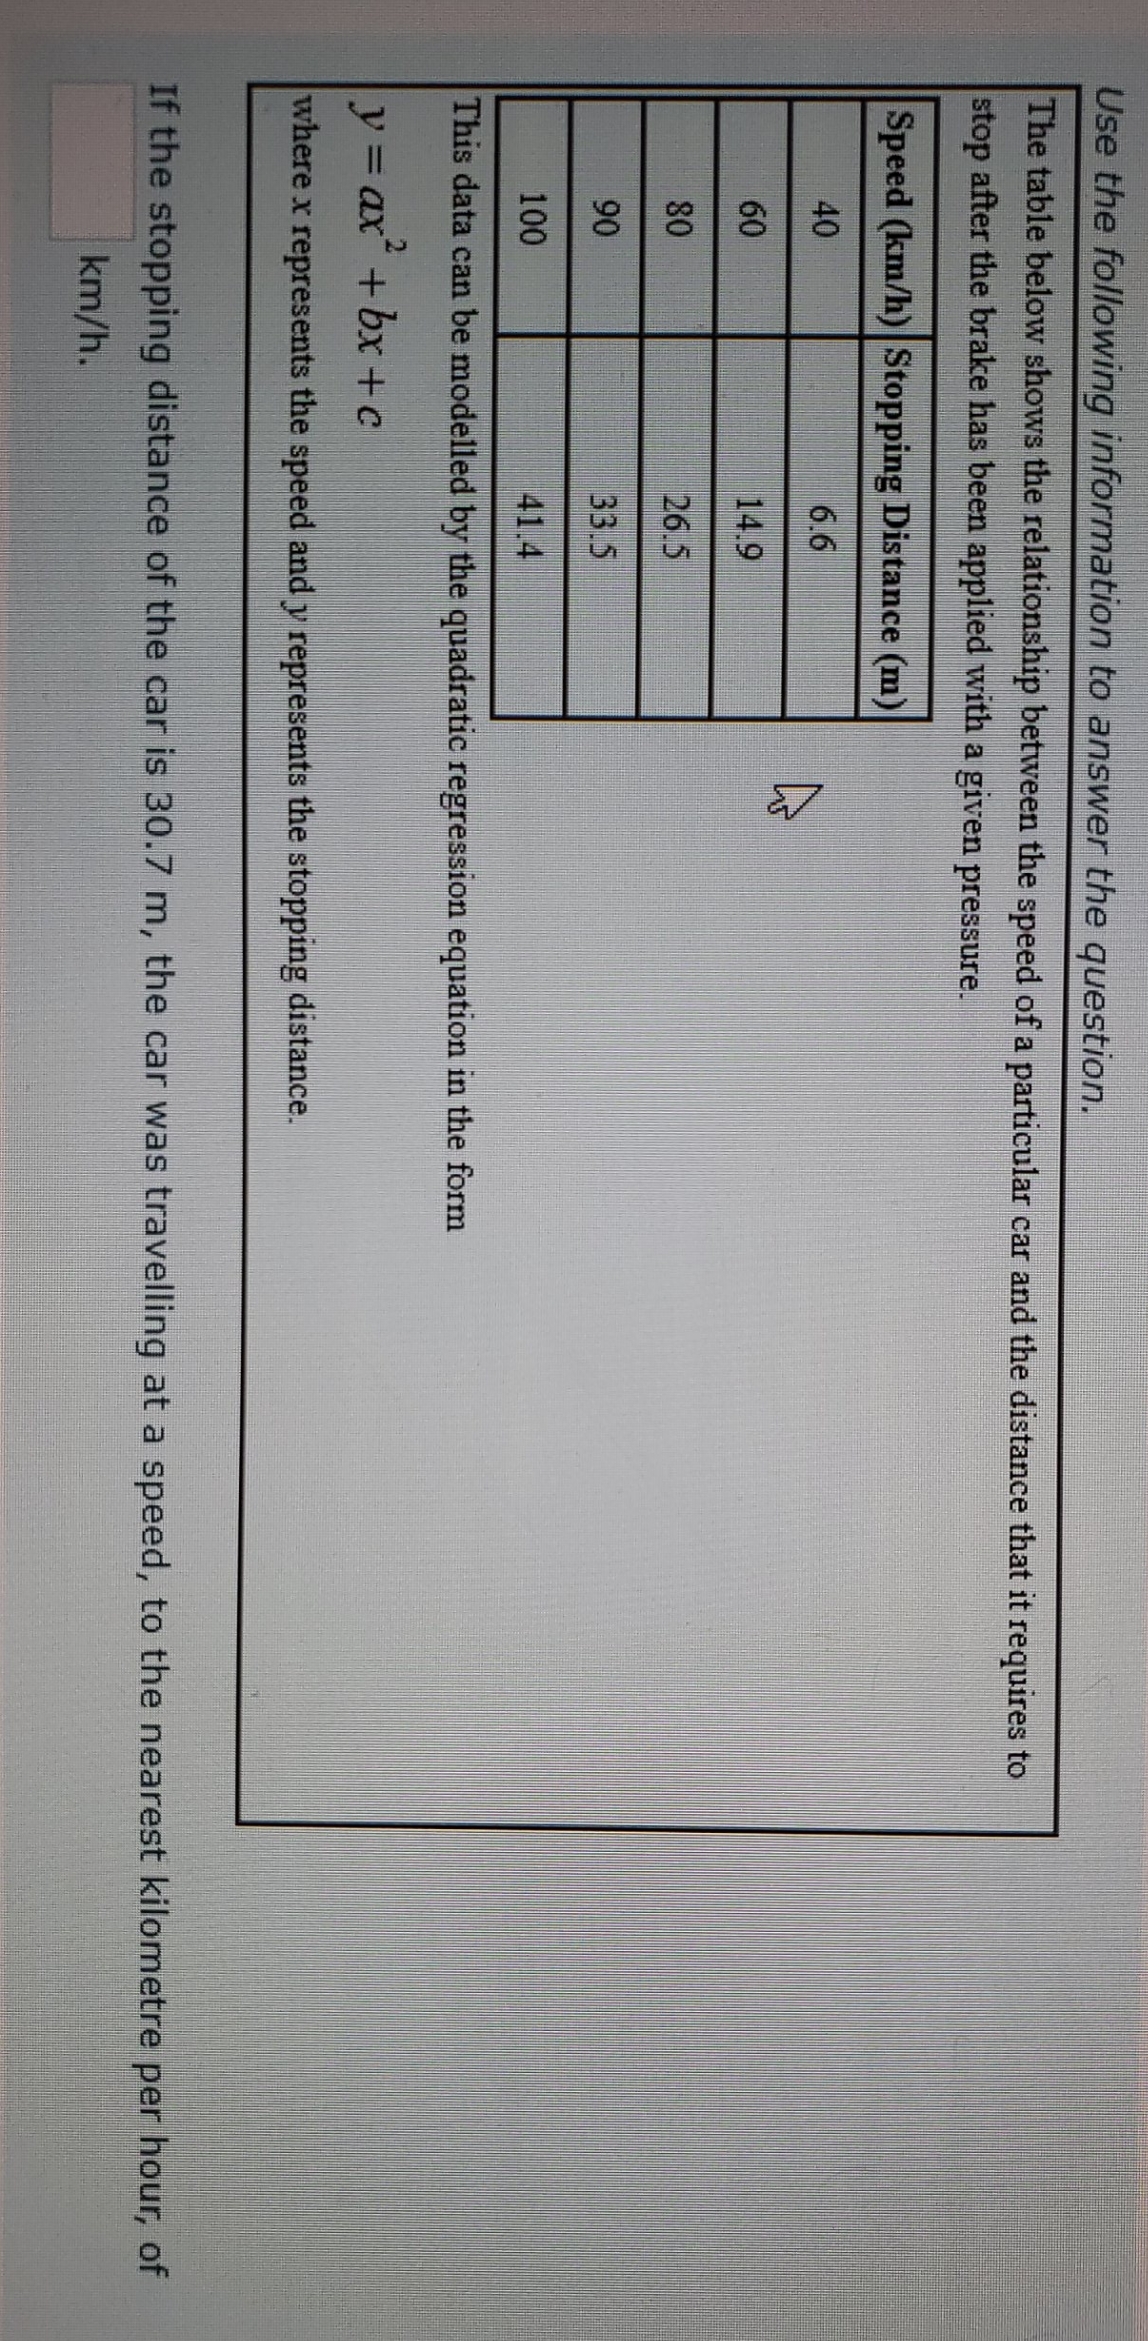
Use the following information to answer the question. The table below shows the relationship between the speed of a particular car and the distance that it requires to stop after the brake has been applied with a given pressure. Speed (km/h) Stopping Distance (m) 6.6 14.9 26.5 33.5 100 41.4 This data can be modelled by the quadratic regression equation in the form y = ax +bx+c where x represents the speed and y represents the stopping distance. If the stopping distance of the car is 30.7 m, the car was travelling at a speed, to the nearest kilometre per hour, of km/h
Step by Step Solution
There are 3 Steps involved in it
1 Expert Approved Answer
Step: 1 Unlock

Question Has Been Solved by an Expert!
Get step-by-step solutions from verified subject matter experts
Step: 2 Unlock
Step: 3 Unlock