

Question: Polynomial Regression The table below shows the electricity consumptions in kilowatt-hours per month from ten houses and the square footage of those houses.The scatter plot
Polynomial Regression
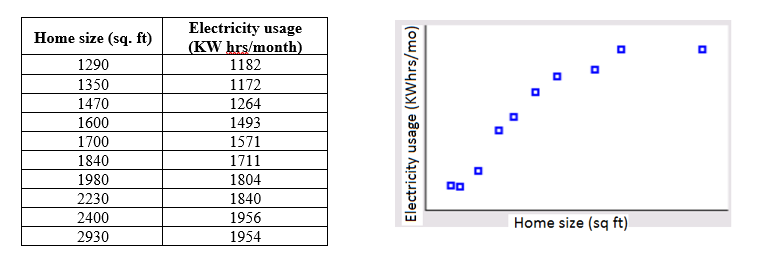
The table below shows the electricity consumptions in kilowatt-hours per month from ten houses and the square footage of those houses.The scatter plot of the data is shown.
\f
Step by Step Solution
There are 3 Steps involved in it
1 Expert Approved Answer
Step: 1 Unlock

Question Has Been Solved by an Expert!
Get step-by-step solutions from verified subject matter experts
Step: 2 Unlock
Step: 3 Unlock