

Question: Population = 7 2 , 1 7 3 Area = 7 0 sq mi Registered vehicles = 2 6 , 6 8 5 Single -
Population
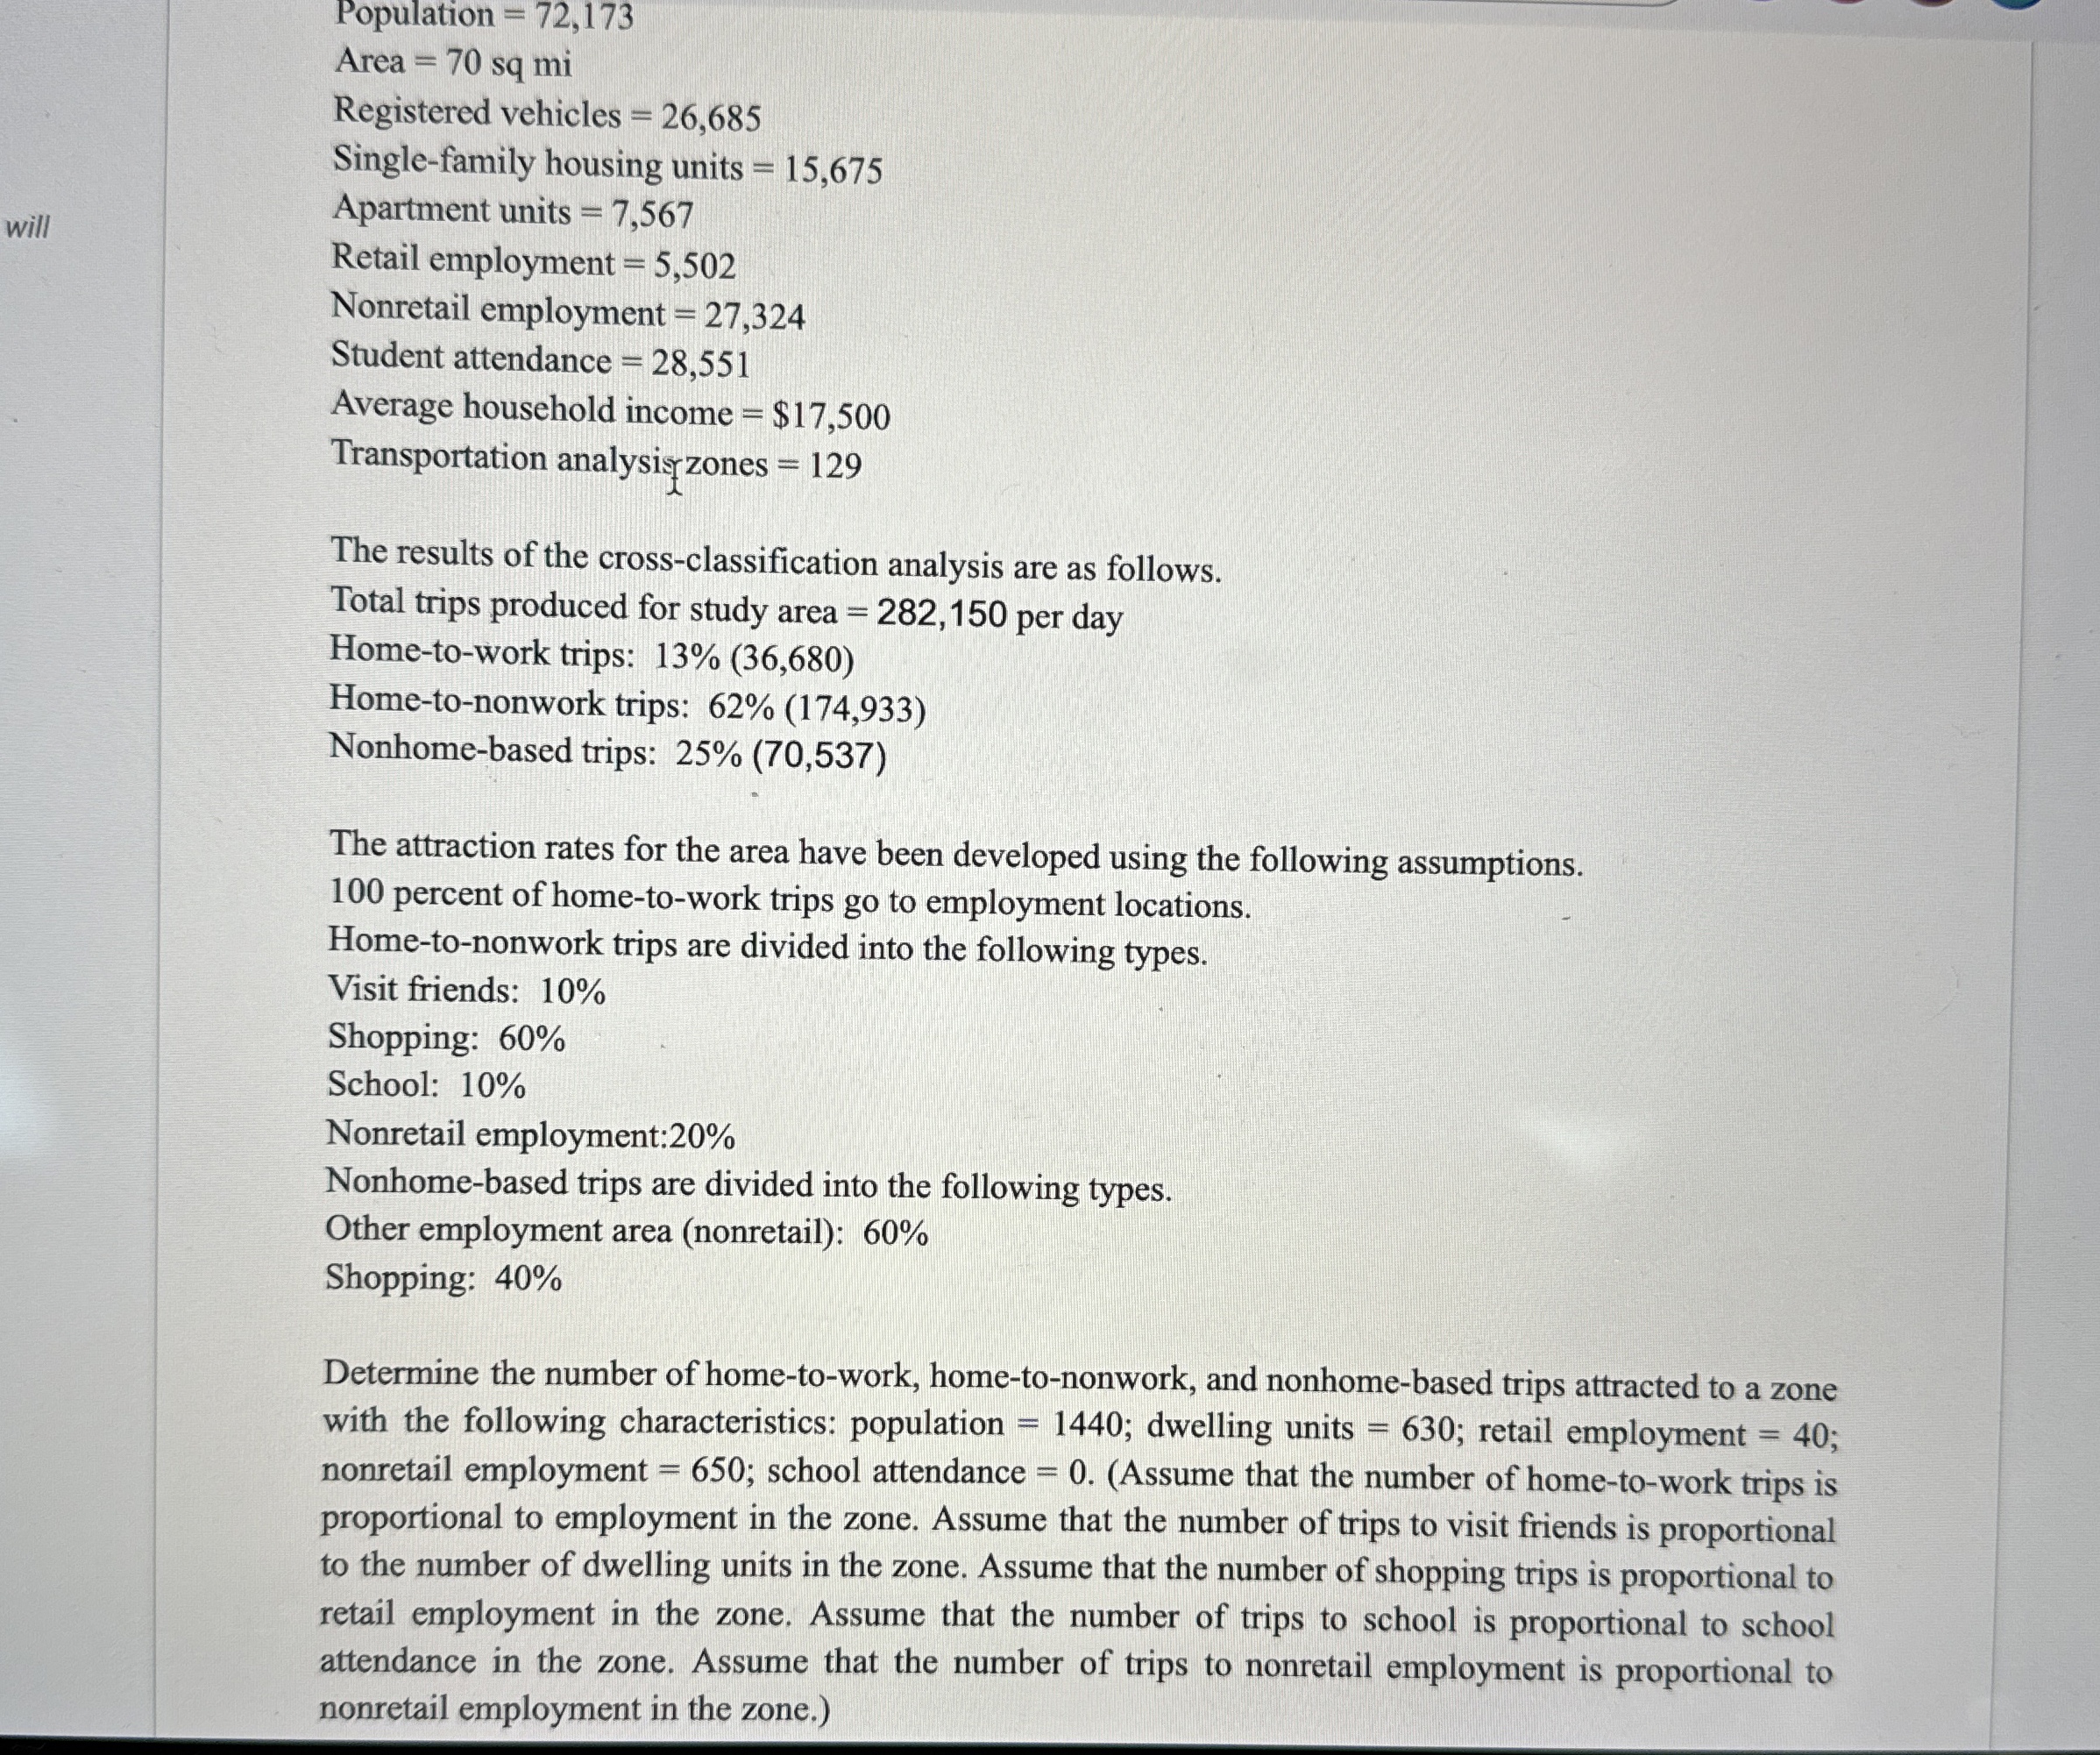
Area sq mi
Registered vehicles
Singlefamily housing units
Apartment units
Retail employment
Nonretail employment
Student attendance
Average household income $
Transportation analysigzones
The results of the crossclassification analysis are as follows.
Total trips produced for study area per day
Hometowork trips:
Hometononwork trips:
Nonhomebased trips:
The attraction rates for the area have been developed using the following assumptions.
percent of hometowork trips go to employment locations.
Hometononwork trips are divided into the following types.
Visit friends:
Shopping:
School:
Nonretail employment:
Nonhomebased trips are divided into the following types.
Other employment area nonretail:
Shopping:
Determine the number of hometowork, hometononwork, and nonhomebased trips attracted to a zone
with the following characteristics: population ; dwelling units ; retail employment ;
nonretail employment ; school attendance Assume that the number of hometowork trips is
proportional to employment in the zone. Assume that the number of trips to visit friends is proportional
to the number of dwelling units in the zone. Assume that the number of shopping trips is proportional to
retail employment in the zone. Assume that the number of trips to school is proportional to school
attendance in the zone. Assume that the number of trips to nonretail employment is proportional to
nonretail employment in the zone.Population
Area sq mi
Registered vehicles
Singlefamily housing units
Apartment units
Retail employment
Nonretail employment
Student attendance
Average household income $
Transportation analysigzones
The results of the crossclassification analysis are as follows.
Total trips produced for study area per day
Hometowork trips:
Hometononwork trips:
Nonhomebased trips:
The attraction rates for the area have been developed using the following assumptions.
percent of hometowork trips go to employment locations.
Hometononwork trips are divided into the following types.
Visit friends:
Shopping:
School:
Nonretail employment:
Nonhomebased trips are divided into the following types.
Other employment area nonretail:
Shopping:
Determine the number of hometowork, hometononwork, and nonhomebased trips attracted to a zone
with the following characteristics: population ; dwelling units ; retail employment ;
nonretail employment ; school attendance Assume that the number of hometowork trips is
proportional to employment in the zone. Assume that the number of trips to visit friends is proportional
to the number of dwelling units in the zone. Assume that the number of shopping trips is proportional to
retail employment in the zone. Assume that the number of trips to school is proportional to school
attendance in the zone. Assume that the number of trips to nonretail employment is proportional to
nonretail employment in the zone.
Step by Step Solution
There are 3 Steps involved in it
1 Expert Approved Answer
Step: 1 Unlock

Question Has Been Solved by an Expert!
Get step-by-step solutions from verified subject matter experts
Step: 2 Unlock
Step: 3 Unlock