

Question: Population c. 95 gears that were sampled Parameter d. 2.89 inches Statistics 2. Following data corresponds to arrival time of students to class in reference
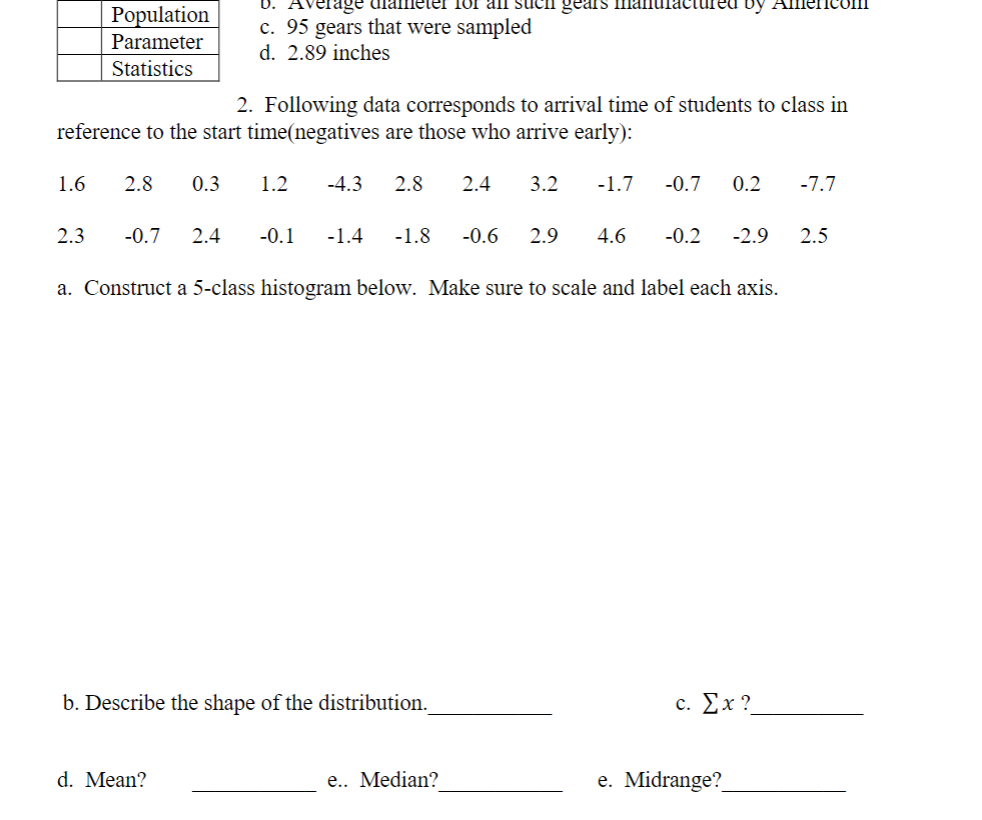
Population c. 95 gears that were sampled Parameter d. 2.89 inches Statistics 2. Following data corresponds to arrival time of students to class in reference to the start time(negatives are those who arrive early): 1.6 2.8 0.3 1.2 -4.3 2.8 2.4 3.2 -1.7 -0.7 0.2 -7.7 2.3 -0.7 2.4 -0.1 -1.4 -1.8 -0.6 2.9 4.6 -0.2 -2.9 2.5 a. Construct a 5-class histogram below. Make sure to scale and label each axis. b. Describe the shape of the distribution. c. Ex ? d. Mean? e.. Median? e. Midrange
Step by Step Solution
There are 3 Steps involved in it
1 Expert Approved Answer
Step: 1 Unlock

Question Has Been Solved by an Expert!
Get step-by-step solutions from verified subject matter experts
Step: 2 Unlock
Step: 3 Unlock