

Question: Population data for two traffic analysis zones ( TAZs ) are plotted and shown below. Apply the most appropriate simple growth model based on the
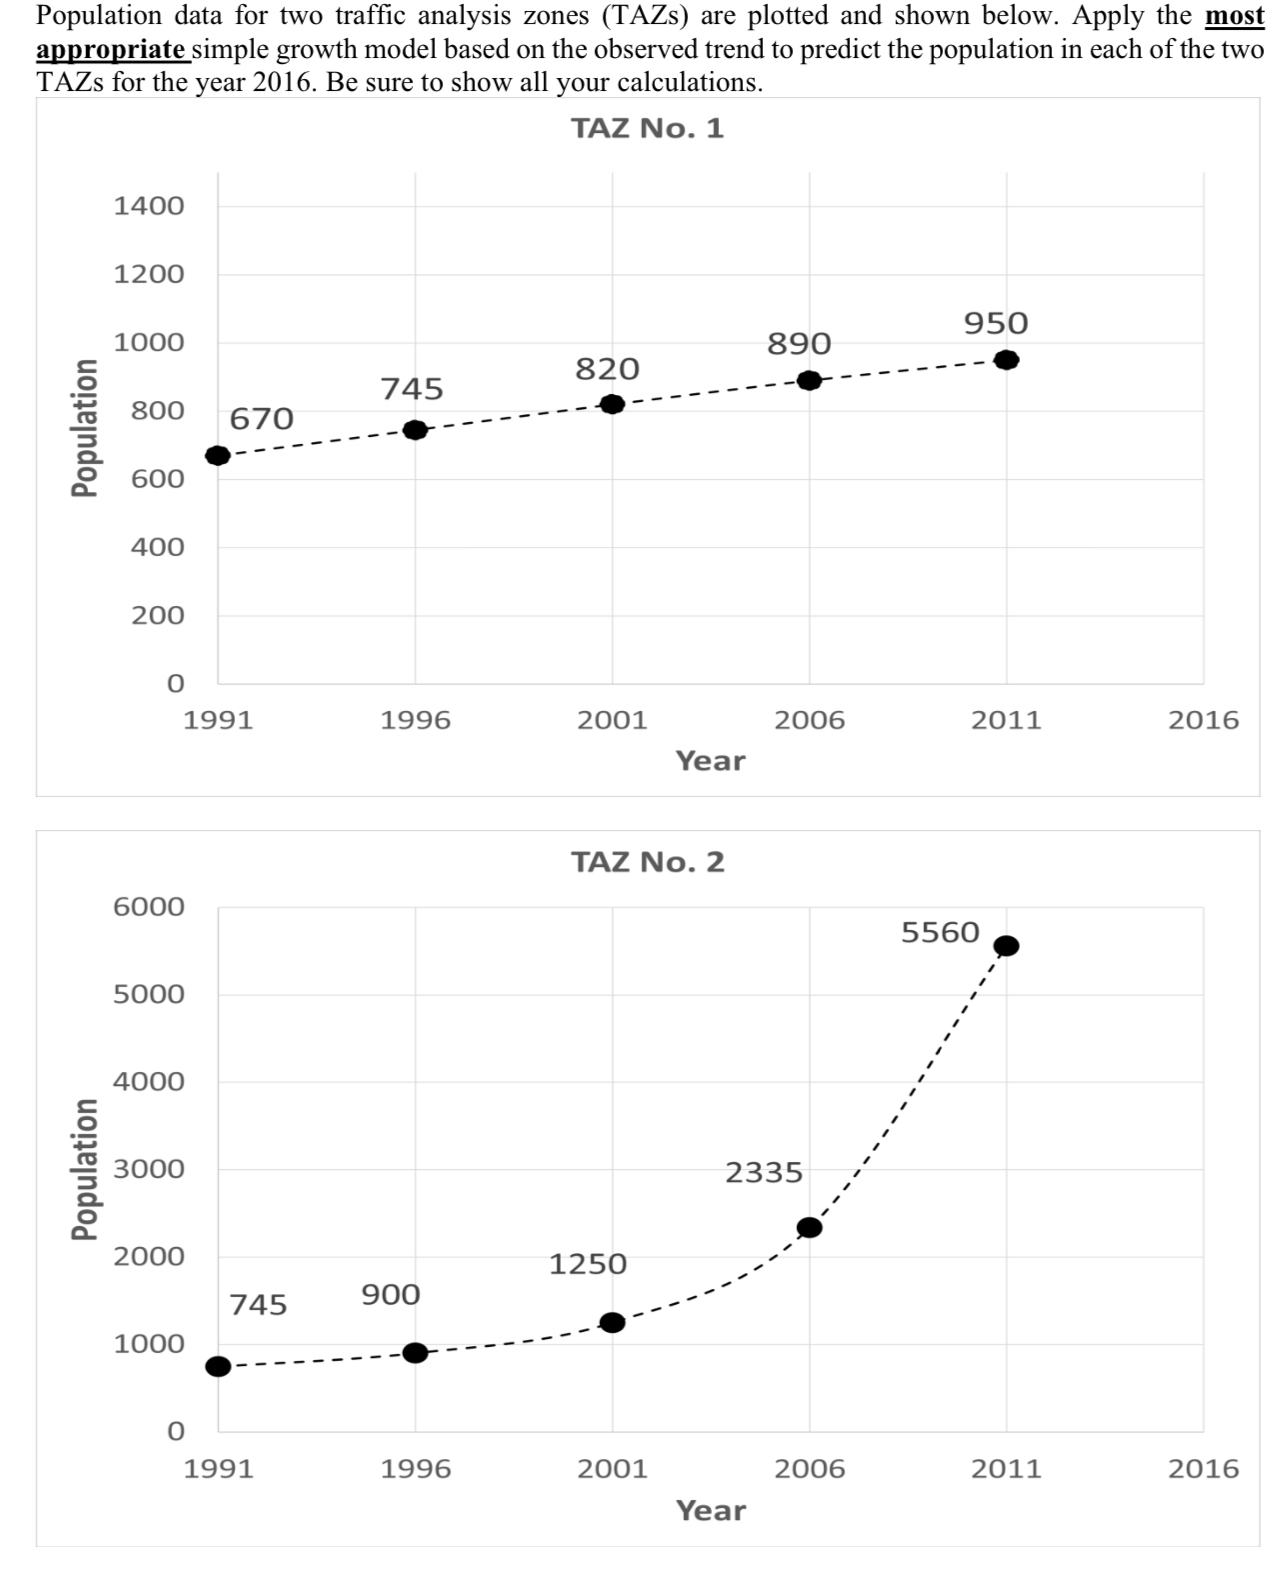
Population data for two traffic analysis zones TAZs are plotted and shown below. Apply the most appropriate simple growth model based on the observed trend to predict the population in each of the two TAZs for the year Be sure to show all your calculations.
TAZ No
TAZ No
Step by Step Solution
There are 3 Steps involved in it
1 Expert Approved Answer
Step: 1 Unlock

Question Has Been Solved by an Expert!
Get step-by-step solutions from verified subject matter experts
Step: 2 Unlock
Step: 3 Unlock