

Question: Portfolio analysis You have been given the expected return data shown in the first table on three assets F, G, and H-over the period 2016-2019:
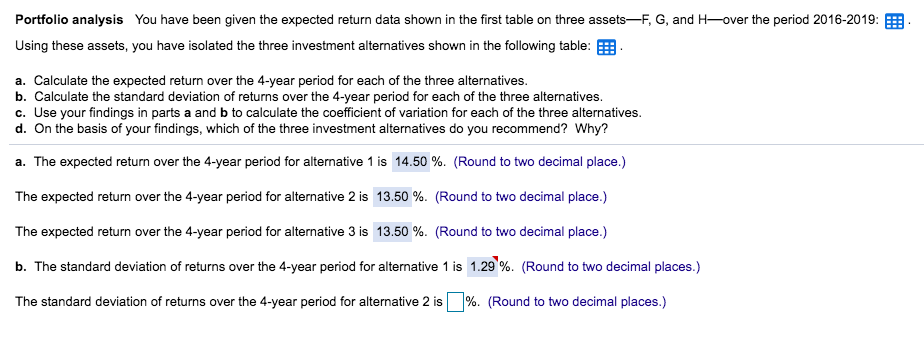
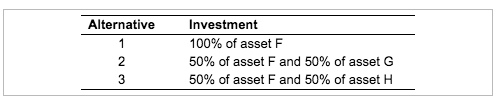
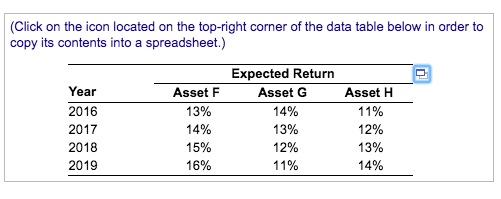
Portfolio analysis You have been given the expected return data shown in the first table on three assets F, G, and H-over the period 2016-2019: Using these assets, you have isolated the three investment alternatives shown in the following table: E . a. Calculate the expected return over the 4-year period for each of the three alternatives. b. Calculate the standard deviation of returns over the 4-year period for each of the three alternatives. c. Use your findings in parts a and b to calculate the coefficient of variation for each of the three alternatives. d. On the basis of your findings, which of the three investment alternatives do you recommend? Why? a. The expected return over the 4-year period for alternative 1 is 14.50 %. (Round to two decimal place.) The expected return over the 4-year period for alternative 2 is 13.50 %. (Round to two decimal place.) The expected return over the 4-year period for alternative 3 is 13.50 %. (Round to two decimal place.) b. The standard deviation of returns over the 4-year period for alternative 1 is 1.29 %. (Round to two decimal places.) The standard deviation of returns over the 4-year period for alternative 2 is % (Round to two decimal places.) Alternative Alternative Investment et Investment 100% of asset F 50% of asset F and 50% of asset G 50% of asset F and 50% of asset H (Click on the icon located on the top-right corner of the data table below in order to copy its contents into a spreadsheet.) Year 2016 Expected Return Asset G 14% 13% 12% 11% Asset F 13% 14% 15% 16% 2017 2018 2019 Asset H 11% 12% 13% 14%
Step by Step Solution
There are 3 Steps involved in it

Get step-by-step solutions from verified subject matter experts