

Question: Portfolio analysis You have been given the expected return data shown in the first table on three assets-F, G, and H-over the period 2016-2019: Using
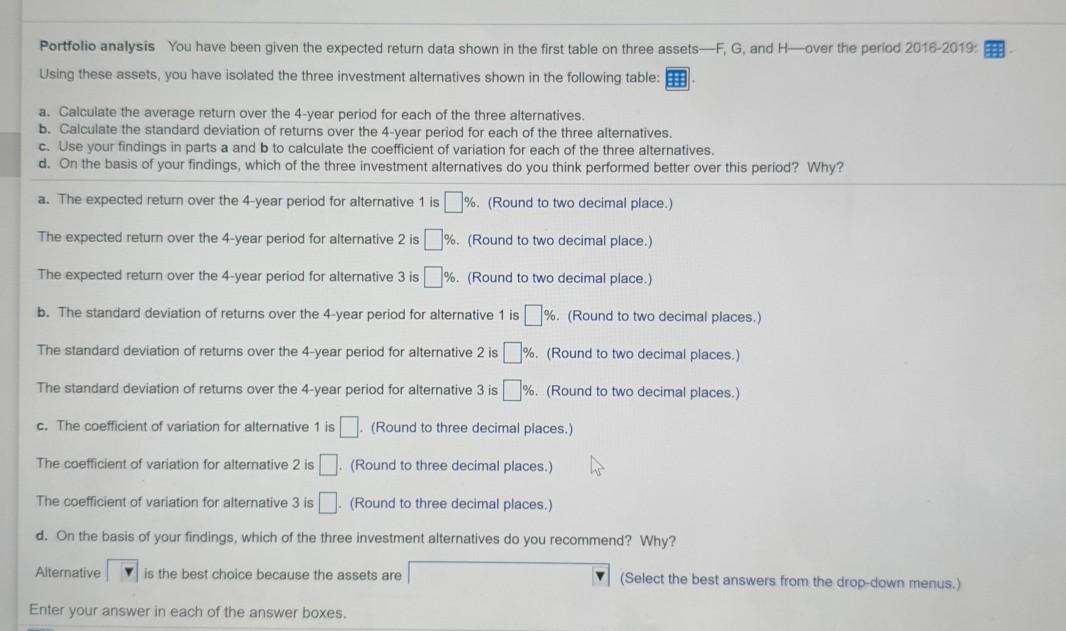
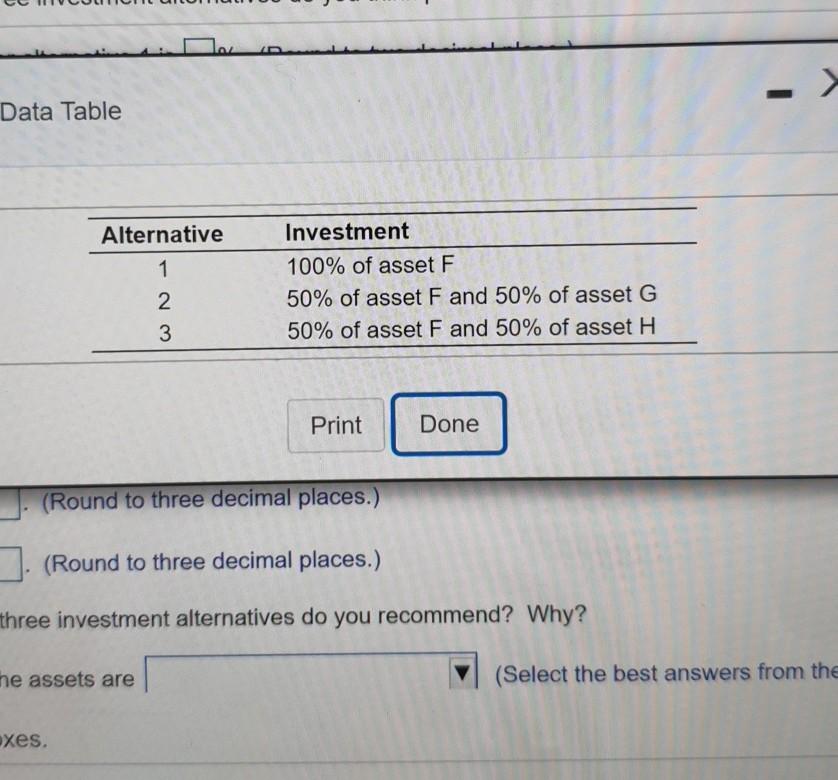
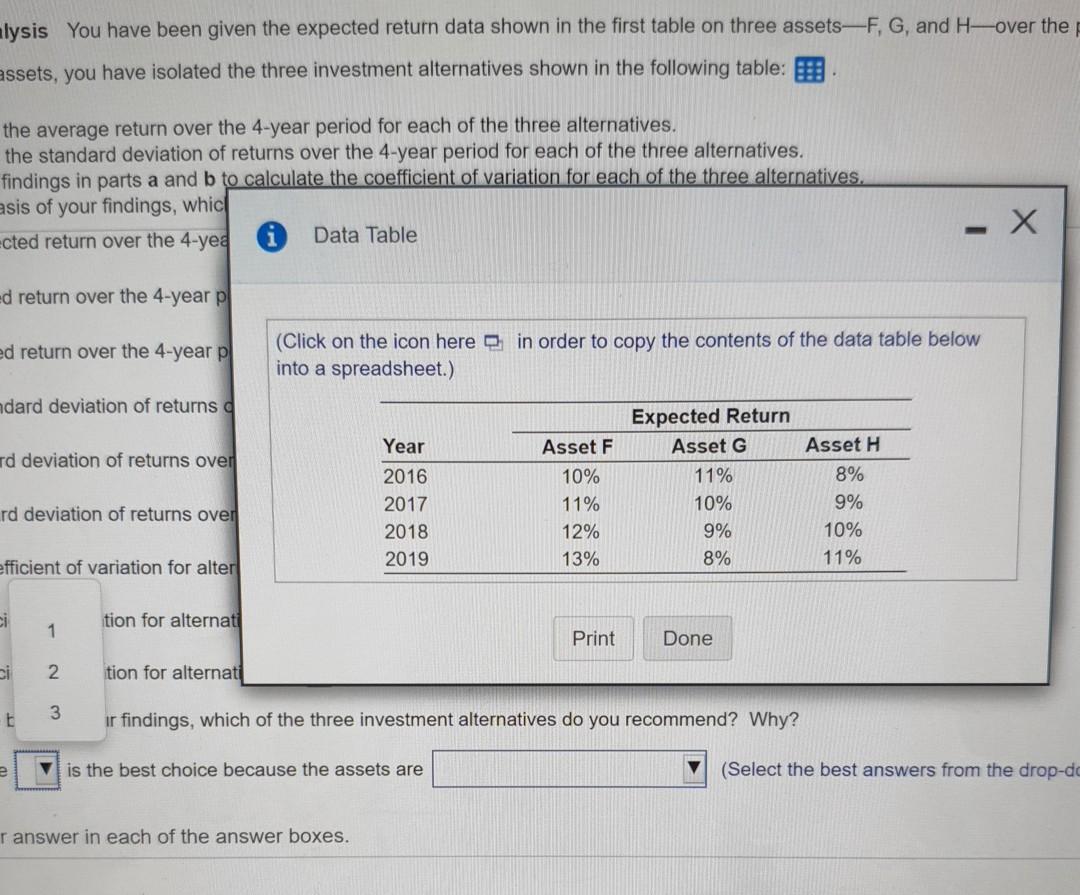
Portfolio analysis You have been given the expected return data shown in the first table on three assets-F, G, and H-over the period 2016-2019: Using these assets, you have isolated the three investment alternatives shown in the following table: a. Calculate the average return over the 4-year period for each of the three alternatives. b. Calculate the standard deviation of returns over the 4-year period for each of the three alternatives. c. Use your findings in parts a and b to calculate the coefficient of variation for each of the three alternatives. d. On the basis of your findings, which of the three investment alternatives do you think performed better over this period? Why? a. The expected return over the 4-year period for alternative 1 is %. (Round to two decimal place.) The expected return over the 4-year period for alternative 2 is %. (Round to two decimal place.) The expected return over the 4-year period for alternative 3 is %. (Round to two decimal place.) b. The standard deviation of returns over the 4-year period for alternative 1 is 3%. (Round to two decimal places.) The standard deviation of returns over the 4-year period for alternative 2 is (Round to two decimal places.) The standard deviation of returns over the 4-year period for alternative 3 is 1%. (Round to two decimal places.) c. The coefficient of variation for alternative 1 is (Round to three decimal places.) The coefficient of variation for alternative 2 is (Round to three decimal places.) The coefficient of variation for alternative 3 is (Round to three decimal places.) d. On the basis of your findings, which of the three investment alternatives do you recommend? Why? Alternative is the best choice because the assets are (Select the best answers from the drop-down menus.) Enter your answer in each of the answer boxes, Data Table Alternative 1 Investment 100% of asset F 50% of asset F and 50% of asset G 50% of asset F and 50% of asset H 2 3 Print Done (Round to three decimal places.) (Round to three decimal places.) - three investment alternatives do you recommend? Why? he assets are (Select the best answers from the xes. lysis You have been given the expected return data shown in the first table on three assets-F, G, and Hover the assets, you have isolated the three investment alternatives shown in the following table: the average return over the 4-year period for each of the three alternatives. the standard deviation of returns over the 4-year period for each of the three alternatives. findings in parts a and b to calculate the coefficient of variation for each of the three alternatives. asis of your findings, whic cted return over the 4-yea Data Table ed return over the 4-year pl ed return over the 4-year pl (Click on the icon here in order to copy the contents of the data table below into a spreadsheet.) dard deviation of returns rd deviation of returns over Year 2016 2017 2018 2019 Asset F 10% 11% 12% 13% Expected Return Asset G 11% 10% 9% 8% Asset H 8% 9% 10% 11% rd deviation of returns over efficient of variation for alter i tion for alternati 1 Print Done 2. tion for alternati E 3 ir findings, which of the three investment alternatives do you recommend? Why? e is the best choice because the assets are (Select the best answers from the drop-do r answer in each of the answer boxes
Step by Step Solution
There are 3 Steps involved in it

Get step-by-step solutions from verified subject matter experts