

Question: Portfolio return and standard deviation Personal Finance Problem Jamie Wong is thinking of building an investment portfolio containing two stocks, Land M. Stock L will
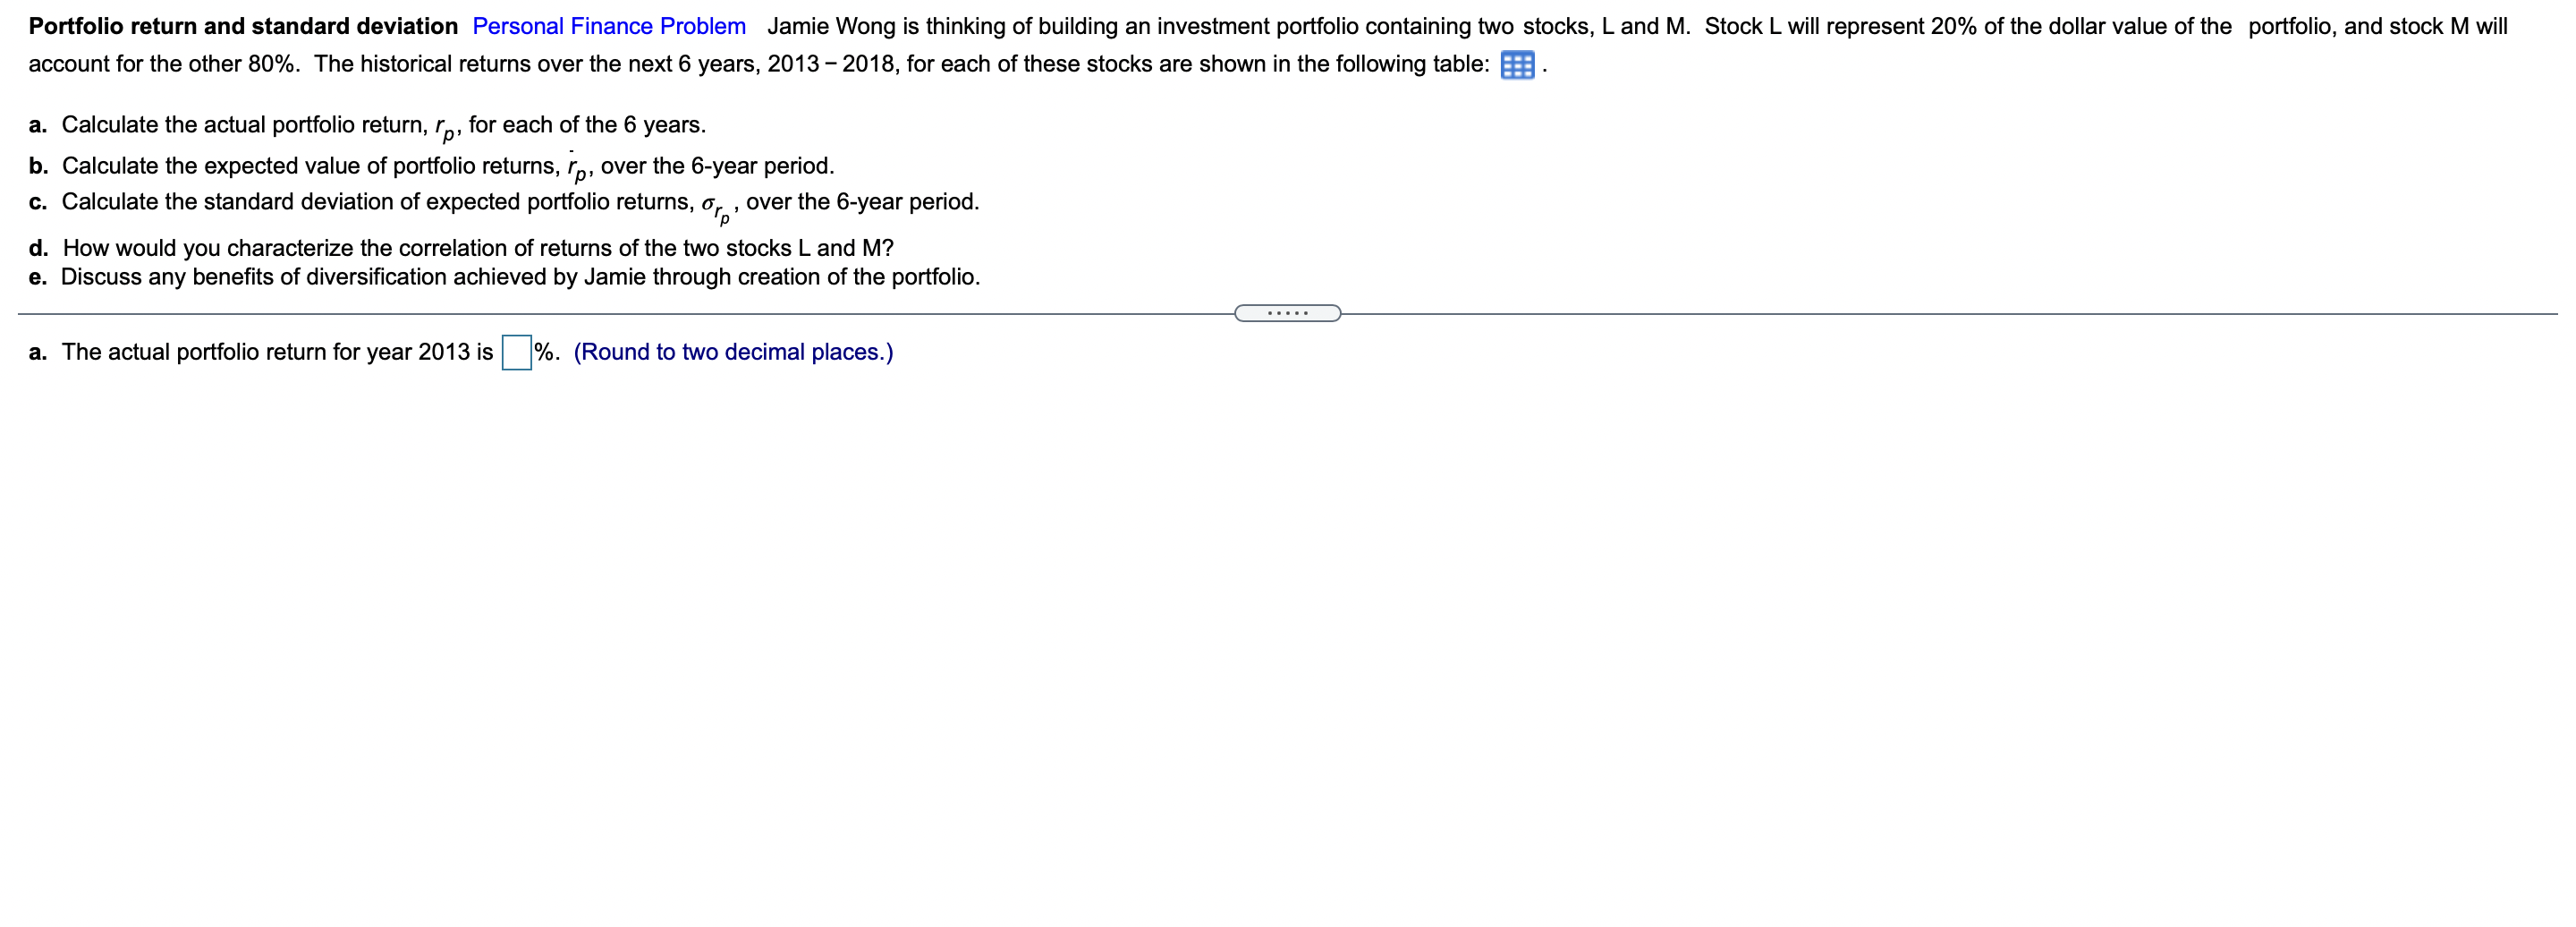
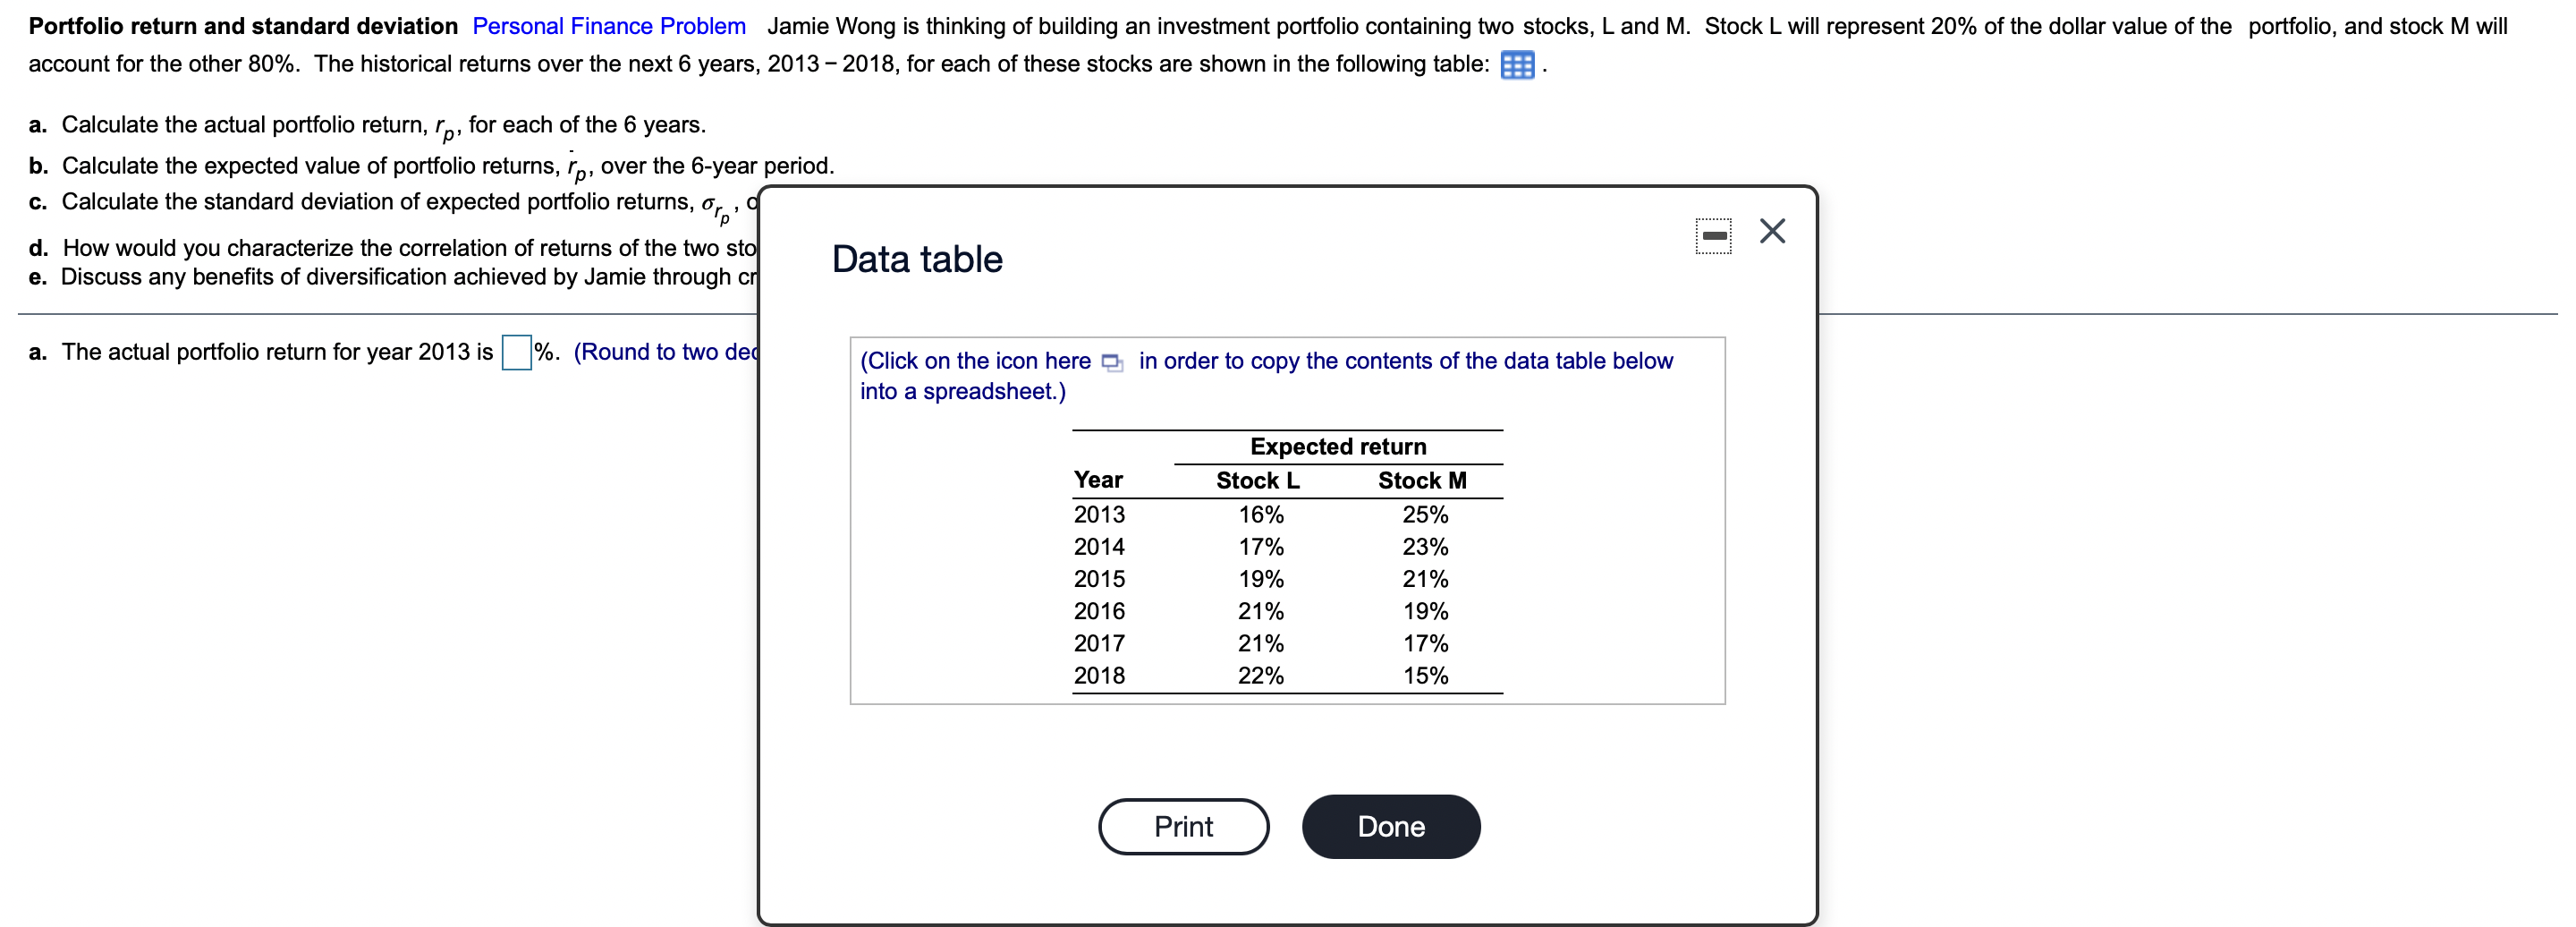
Portfolio return and standard deviation Personal Finance Problem Jamie Wong is thinking of building an investment portfolio containing two stocks, Land M. Stock L will represent 20% of the dollar value of the portfolio, and stock M will account for the other 80%. The historical returns over the next 6 years, 2013 - 2018, for each of these stocks are shown in the following table: B. a. Calculate the actual portfolio return, rp, for each of the 6 years. b. Calculate the expected value of portfolio returns, lp, over the 6-year period. C. Calculate the standard deviation of expected portfolio returns, Op. over the 6-year period. d. How would you characterize the correlation of returns of the two stocks L and M? e. Discuss any benefits of diversification achieved by Jamie through creation of the portfolio. a. The actual portfolio return for year 2013 is %. (Round to two decimal places.) Portfolio return and standard deviation Personal Finance Problem Jamie Wong is thinking of building an investment portfolio containing two stocks, L and M. Stock L will represent 20% of the dollar value of the portfolio, and stock M will account for the other 80%. The historical returns over the next 6 years, 2013 2018, for each of these stocks are shown in the following table: a. Calculate the actual portfolio return, rp, for each of the 6 years. b. Calculate the expected value of portfolio returns, lp, over the 6-year period. c. Calculate the standard deviation of expected portfolio returns, or d. How would you characterize the correlation of returns of the two sto Data table e. Discuss any benefits of diversification achieved by Jamie through cr 0 a. The actual portfolio return for year 2013 is %. (Round to two de (Click on the icon here e in order to copy the contents of the data table below into a spreadsheet.) Year 2013 2014 2015 2016 2017 2018 Expected return Stock L Stock M 16% 25% 17% 23% 19% 21% 21% 19% 21% 17% 22% 15% Print Done
Step by Step Solution
There are 3 Steps involved in it

Get step-by-step solutions from verified subject matter experts