

Question: Portion) Question 5 of 11 This question: 2 Submit test point(s) possible Assume that adults have IQ scores that are normally distributed with a mean
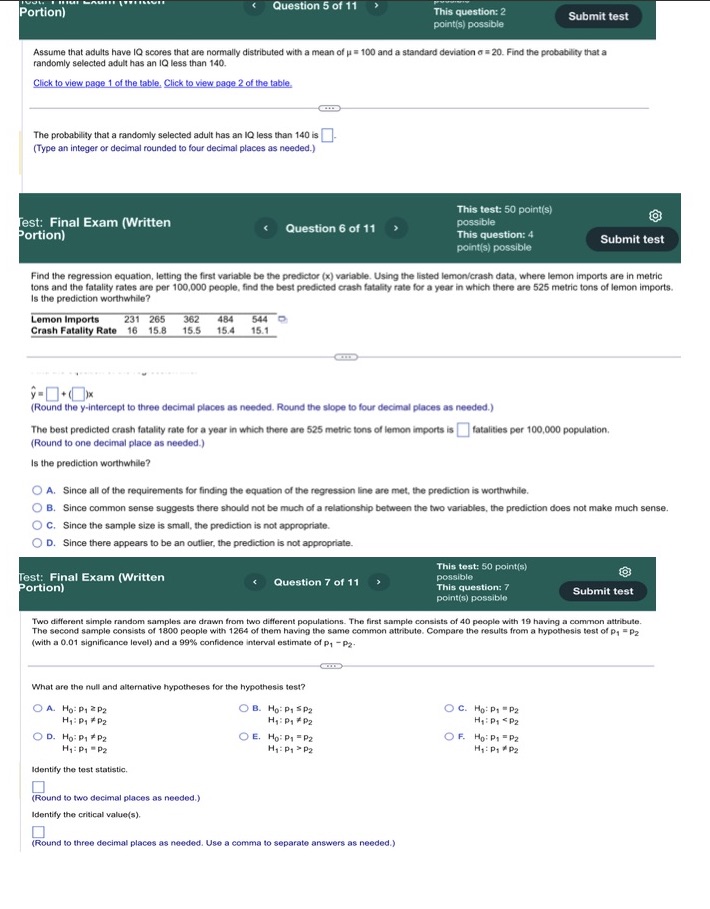
Portion) Question 5 of 11 This question: 2 Submit test point(s) possible Assume that adults have IQ scores that are normally distributed with a mean of p = 100 and a standard deviation a = 20. Find the probability that a randomly selected adult has an IQ less than 140. Click to view page 1 of the table. Click to view page 2 of the table. The probability that a randomly selected adult has an IQ less than 140 is]- (Type an integer or decimal rounded to four decimal places as needed.) This test: 50 point(s) est: Final Exam (Written Portion) Question 6 of 11 possible This question: 4 Submit test point(s) possible Find the regression equation, letting the first variable be the predictor (x) variable. Using the listed lemon/crash data, where lemon imports are in metric tons and the fatality rates are per 100,000 people, find the best predicted crash fatality rate for a year in which there are 525 metric tons of lemon imports. Is the prediction worthwhile? Lemon Imports 231 265 382 484 544 Crash Fatality Rate 16 15.8 15.5 15.4 15.1 (Round the y-intercept to three decimal places as needed. Round the slope to four decimal places as needed.) The best predicted crash fatality rate for a year in which there are 525 metric tons of lemon imports is fatalities per 100,000 population. (Round to one decimal place as needed.) Is the prediction worthwhile? O A. Since all of the requirements for finding the equation of the regression line are met, the prediction is worthwhile. O B. Since common sense suggests there should not be much of a relationship between the two variables, the prediction does not make much sense. O C. Since the sample size is small, the prediction is not appropriate. D. Since there appears to be an outlier, the prediction is not appropriate. This test: 50 point(s) Test: Final Exam (Written possible Portion) Question 7 of 11 This question: 7 Submit test pointis) possible Two different simple random samples are drawn from two different populations. The first sample consists of 40 people with 19 having a common attribute. The second sample consists of 1800 people with 1264 of them having the same common attribute. Compare the results from a hypothesis test of p, - P2 (with a 0.01 significance level) and a 99% confidence Interval estimate of p, - p2 What are the null and alternative hypotheses for the hypothesis test? O A. Hop, 2 P2 O B. Ho: p1 $ P2 O C. Ho: P1 P2 Hip, P2 Hip, P2 H1: P1
Step by Step Solution
There are 3 Steps involved in it

Get step-by-step solutions from verified subject matter experts