

Question: POSSIBLE POINTS: 11 11 2 60 people selected at random were asked their preference for apples or oranges. Use the Venn diagram to find each
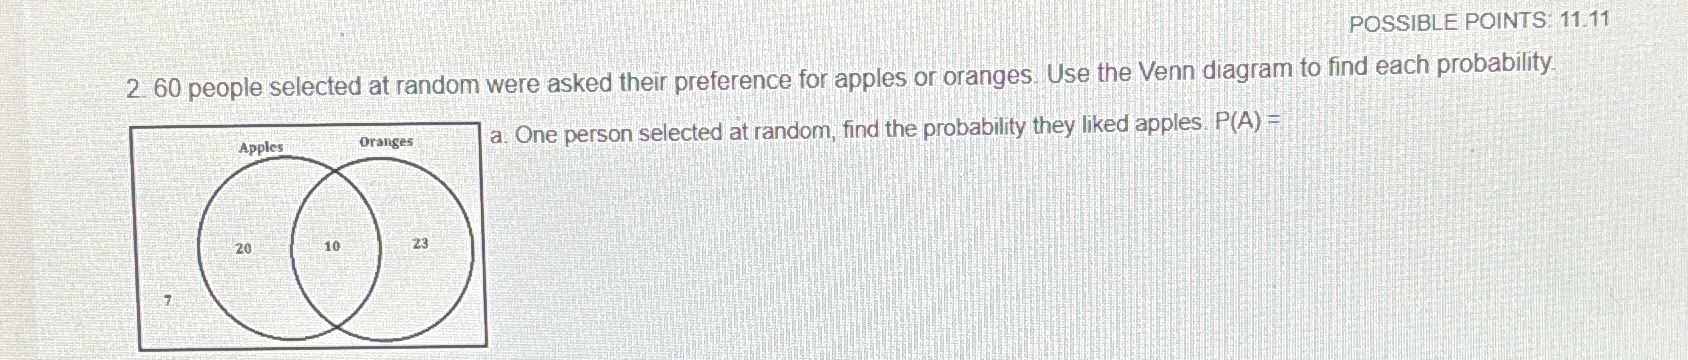
POSSIBLE POINTS: 11 11 2 60 people selected at random were asked their preference for apples or oranges. Use the Venn diagram to find each probability Apples Dranges a. One person selected at random, find the probability they liked apples. P(A) = 23
Step by Step Solution
There are 3 Steps involved in it
1 Expert Approved Answer
Step: 1 Unlock

Question Has Been Solved by an Expert!
Get step-by-step solutions from verified subject matter experts
Step: 2 Unlock
Step: 3 Unlock