

Question: The table below is extracted from Goodland Republic Bureau of Statistics records for 2016 -2017. Use the information to answer the questions that follow.
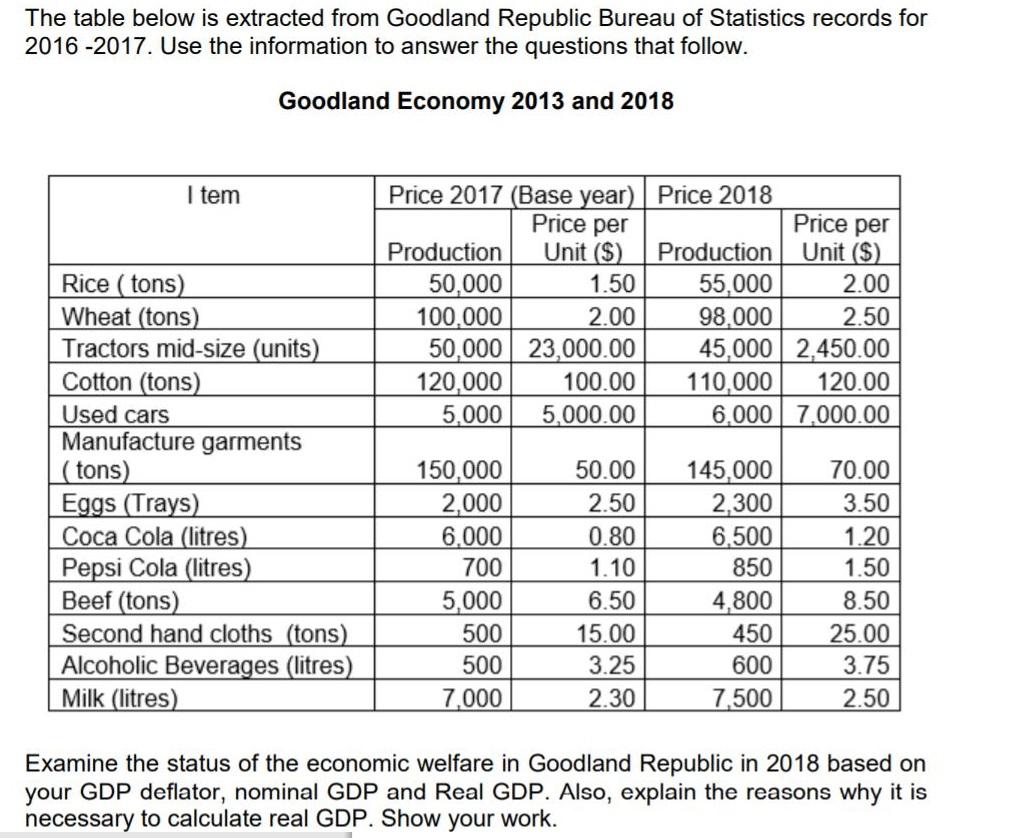
The table below is extracted from Goodland Republic Bureau of Statistics records for 2016 -2017. Use the information to answer the questions that follow. Goodland Economy 2013 and 2018 Price 2017 (Base year) Price 2018 Price per Unit ($) 1.50 I tem Price per Production Unit ($) 55,000 98,000 Production Rice ( tons) Wheat (tons) Tractors mid-size (units) Cotton (tons) Used cars Manufacture garments ( tons) Eggs (Trays) Coca Cola (litres) Pepsi Cola (litres) Beef (tons) Second hand cloths (tons) Alcoholic Beverages (litres) Milk (litres) 50,000 100,000 50,000 23,000.00 120,000 5,000 2.00 2.50 45,000 2,450.00 110,000 6.000 7,000.00 2.00 100.00 5,000.00 120.00 150,000 2,000 6.000 50.00 145,000 2,300 6,500 70.00 2.50 3.50 0.80 1.20 700 1.10 850 1.50 5,000 500 6.50 4,800 450 8.50 15.00 25.00 3.75 500 3.25 600 7,000 2.30 7,500 2.50 Examine the status of the economic welfare in Goodland Republic in 2018 based on your GDP deflator, nominal GDP and Real GDP. Also, explain the reasons why it is necessary to calculate real GDP. Show your work.
Step by Step Solution
3.31 Rating (157 Votes )
There are 3 Steps involved in it
Nominal GDP Nominal GDP is the total monetary value of good and services produced in a country and e... View full answer

Get step-by-step solutions from verified subject matter experts