

Question: Posting this for the third time after taking out the second half of the question. Will post the second half of the question once this
Posting this for the third time after taking out the second half of the question.
Will post the second half of the question once this part is completed with the answer. 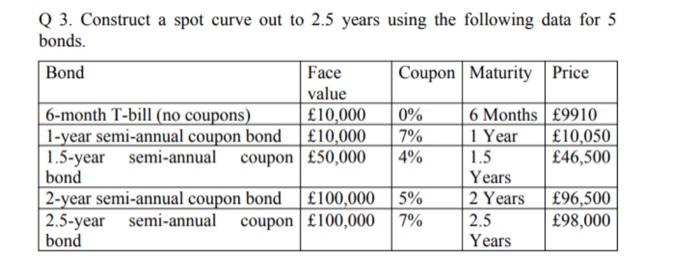
Q 3. Construct a spot curve out to 2.5 years using the following data for 5 bonds. Bond Face Coupon Maturity Price value 6-month T-bill (no coupons) 10,000 0% 6 Months 9910 1-year semi-annual coupon bond 10,000 7% 1 Year 10,050 1.5-year semi-annual coupon 50,000 4% 1.5 46,500 bond Years 2-year semi-annual coupon bond 100,000 5% 2 Years 96,500 2.5-year semi-annual coupon 100,000 7% 2.5 98,000 bond Years
Step by Step Solution
There are 3 Steps involved in it
1 Expert Approved Answer
Step: 1 Unlock

Question Has Been Solved by an Expert!
Get step-by-step solutions from verified subject matter experts
Step: 2 Unlock
Step: 3 Unlock