

Question: Post-Lab. 1. Use your data to produce graphs that illustrate the gas law relationships. Mini examples (without data) are shown below. (Do not use these
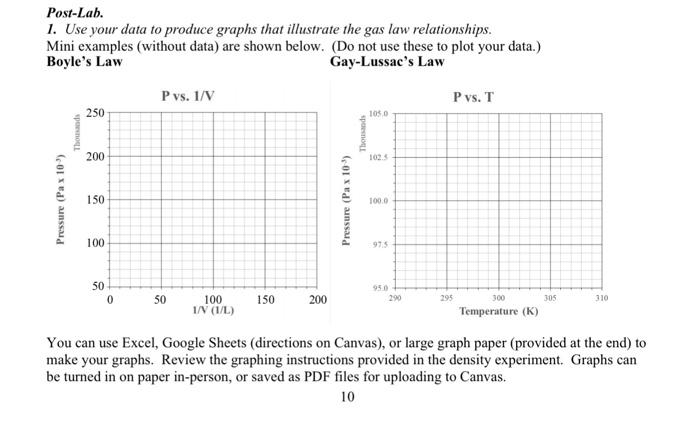
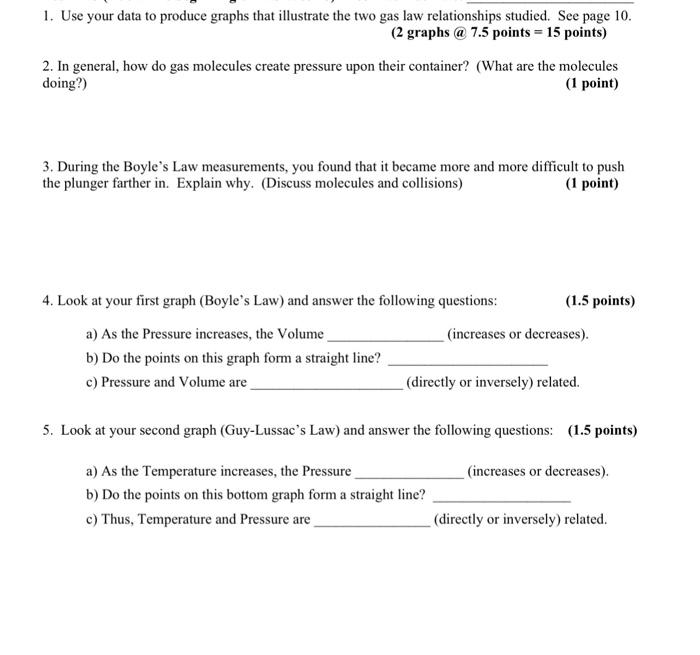
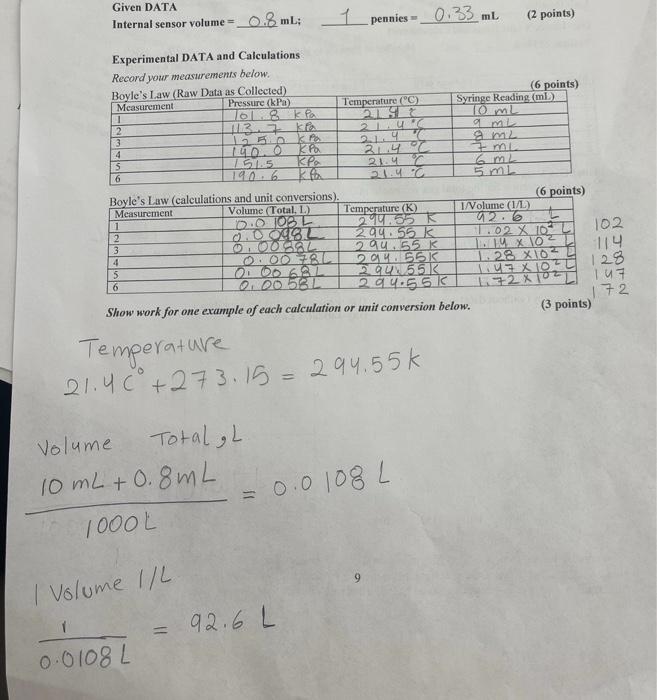
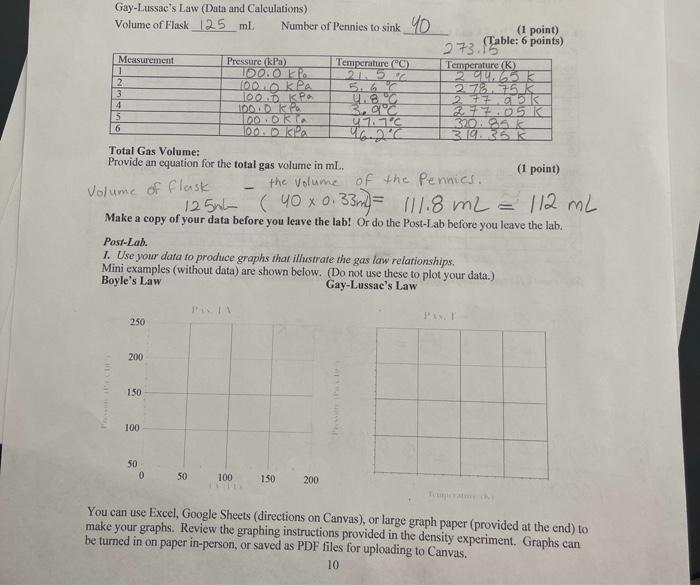
Post-Lab. 1. Use your data to produce graphs that illustrate the gas law relationships. Mini examples (without data) are shown below. (Do not use these to plot your data.) Boyle's Law Gay-Lussac's Law Pvs. 1/V P vs. T 250 1050 200 102.5 Thousands Pressure (Pax 10) Thousands Pressure (Pax 10) 150 100.0 100 97,5 50 950 0 50 150 200 295 305 310 100 1/V (1/1) 300 Temperature (K) You can use Excel, Google Sheets (directions on Canvas), or large graph paper (provided at the end) to make your graphs. Review the graphing instructions provided in the density experiment. Graphs can be turned in on paper in-person, or saved as PDF files for uploading to Canvas. 10 1. Use your data to produce graphs that illustrate the two gas law relationships studied. See page 10. (2 graphs @ 7.5 points = 15 points) 2. In general, how do gas molecules create pressure upon their container? (What are the molecules doing?) (1 point) 3. During the Boyle's Law measurements, you found that it became more and more difficult to push the plunger farther in. Explain why. (Discuss molecules and collisions) (1 point) 4. Look at your first graph (Boyle's Law) and answer the following questions: (1.5 points) a) As the Pressure increases, the Volume (increases or decreases). b) Do the points on this graph form a straight line? c) Pressure and Volume are (directly or inversely) related. 5. Look at your second graph (Guy-Lussac's Law) and answer the following questions: (1.5 points) (increases or decreases). a) As the Temperature increases, the Pressure b) Do the points on this bottom graph form a straight line? c) Thus, Temperature and Pressure are (directly or inversely related. Given DATA Internal sensor volume = 0.8 ml: 1_pennies = _ 0.33 ml (2 points) KA Experimental DATA and Calculations Record your measurements below. Boyle's Law (Raw Data as Collected) (6 points) Measurement Pressure (kPa) Temperature (C) Syringe Reading (ml) 1 ka 10mL 2 113k 2LUR mi 3 50 214 m2 4 140.0 21.4 T 151.5 . 21.4 6 6 140.6 5 L Boyle's Law (calculations and unit conversions). (6 points) Measurement Volume (Total, L.) Temperature (K) I/Volume (1/1) 1 0.0 1082 214.55 a2.6 2 0.0082 294155 K 11.02 X 10 3 0.001562 294 55K 14X10 4 0.00 782 114 2016 55K 128 X10 5 OOO 6.2L 294551 6 000 582 29 4.551 107 72 Show work for one example of each calculation or unit conversion below. (3 points) IZOWSE 102 1.4 x 10⁻⁶ 23 1+2 x 10³ Temperature 21.40 +273.15 = 294.55k Volume Total L 10 mL + 0.8mL = 0.0 1000L 0.0108L 9 I Volume 1/L 1 92.6 L 0.0108L 1 Gay-Lussac's Law (Data and Calculations) Volume of Flask 125 ml Number of Pennies to sink_40 (1 point) 273.156 (Table: 6 points) Measurement Pressure (kPa) Temperature (C) Temperature (K) 100.0 FP 21. 52 2 000 kPa 5.6% 273.75K 3 ODP u. 27795 IDONDA 3,02 5 DO ORTA 47.70 370.95 K 100 DK 46.2C 3.19.35 K Total Gas Volume: Provide an equation for the total gas volume in ml. (1 point) the volume of the Pennies. 4 6 Volume of flask 1250 (40 x 0.33m) - 111.8 m2 = 112 mL = Make a copy of your data before you leave the lab! Or do the Post-Lab before you leave the lab. Post-Lah. 1. Use your data to produce graphs that illustrate the gas law relationships. Mini examples (without data) are shown below. (Do not use these to plot your data.) Boyle's Law Gay-Lussae's Law 250 200) 150 100 50 0 50 100 150 200 You can use Excel, Google Sheets (directions on Canvas), or large graph paper (provided at the end) to make your graphs. Review the graphing instructions provided in the density experiment. Graphs can be turned in on paper in-person, or saved as PDF files for uploading to Canvas. 10
Step by Step Solution
There are 3 Steps involved in it

Get step-by-step solutions from verified subject matter experts