

Question: pplease explain the table and data. thank you Table 5. In-Sample Spanning Test for the GMF Table 5 United United States Kingdom Japan Germany Retumb2/B2
 pplease explain the table and data.
thank you
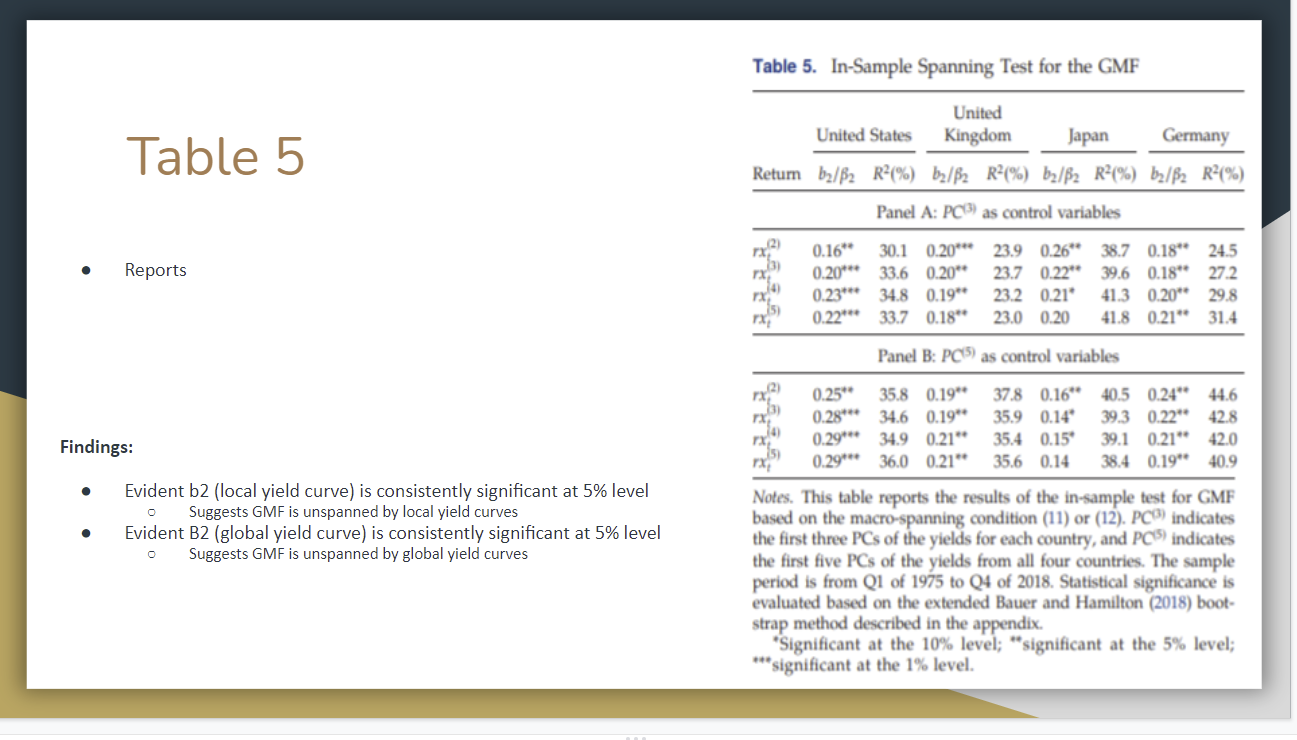
Table 5. In-Sample Spanning Test for the GMF Table 5 United United States Kingdom Japan Germany Retumb2/B2 R2(%) b21f2 R2(%) b2/B2 R2(%) bz/B2 R2(%) Panel A: PC3) as control variables Reports 3) 0.16" 30.10.20*** 23.9 0.26" 38.7 0.18** 24.5 0.20*** 33.6 0.20 23.7 0.22 39.6 0.18" 27.2 0.23*** 34.8 0.19 23.2 0.21 41.3 0.20" 29.8 0.22*** 33.7 0.18" 23.0 0.20 41.8 0.21" 31.4 Panel B: P05) as control variables m 0.25" 35.8 0.19" 37.8 0.16" 40.5 0.24" 44.6 0.28*** 34.6 0.19 35.9 0.14 39.3 0.22" 42.8 0.29 34.9 0.21" 35.4 0.15 39.1 0.21" 42.0 0.29*** 36.0 0.21" 35.6 0.14 38.4 0.19" 40.9 Findings: 15) 0 Evident b2 (local yield curve) is consistently significant at 5% level Suggests GMF is unspanned by local yield curves Evident B2 (global yield curve) is consistently significant at 5% level Suggests GMF is unspanned by global yield curves Notes. This table reports the results of the in-sample test for GMF based on the macro-spanning condition (11) or (12). PC3) indicates the first three PCs of the yields for each country, and PCS) indicates the first five PCs of the yields from all four countries. The sample period is from Q1 of 1975 to Q4 of 2018. Statistical significance is evaluated based on the extended Bauer and Hamilton (2018) boot- strap method described in the appendix. Significant at the 10% level; "significant at the 5% level; *** significant at the 1% level. Table 5. In-Sample Spanning Test for the GMF Table 5 United United States Kingdom Japan Germany Retumb2/B2 R2(%) b21f2 R2(%) b2/B2 R2(%) bz/B2 R2(%) Panel A: PC3) as control variables Reports 3) 0.16" 30.10.20*** 23.9 0.26" 38.7 0.18** 24.5 0.20*** 33.6 0.20 23.7 0.22 39.6 0.18" 27.2 0.23*** 34.8 0.19 23.2 0.21 41.3 0.20" 29.8 0.22*** 33.7 0.18" 23.0 0.20 41.8 0.21" 31.4 Panel B: P05) as control variables m 0.25" 35.8 0.19" 37.8 0.16" 40.5 0.24" 44.6 0.28*** 34.6 0.19 35.9 0.14 39.3 0.22" 42.8 0.29 34.9 0.21" 35.4 0.15 39.1 0.21" 42.0 0.29*** 36.0 0.21" 35.6 0.14 38.4 0.19" 40.9 Findings: 15) 0 Evident b2 (local yield curve) is consistently significant at 5% level Suggests GMF is unspanned by local yield curves Evident B2 (global yield curve) is consistently significant at 5% level Suggests GMF is unspanned by global yield curves Notes. This table reports the results of the in-sample test for GMF based on the macro-spanning condition (11) or (12). PC3) indicates the first three PCs of the yields for each country, and PCS) indicates the first five PCs of the yields from all four countries. The sample period is from Q1 of 1975 to Q4 of 2018. Statistical significance is evaluated based on the extended Bauer and Hamilton (2018) boot- strap method described in the appendix. Significant at the 10% level; "significant at the 5% level; *** significant at the 1% level
Step by Step Solution
There are 3 Steps involved in it

Get step-by-step solutions from verified subject matter experts