

Question: PPlease list step by step. e08SampleAnalysis - Excel 5 Home - O X SIMS 2 Share 1.00 Point: XL Step 8.3.4: Create a Histogram File
 PPlease list step by step.
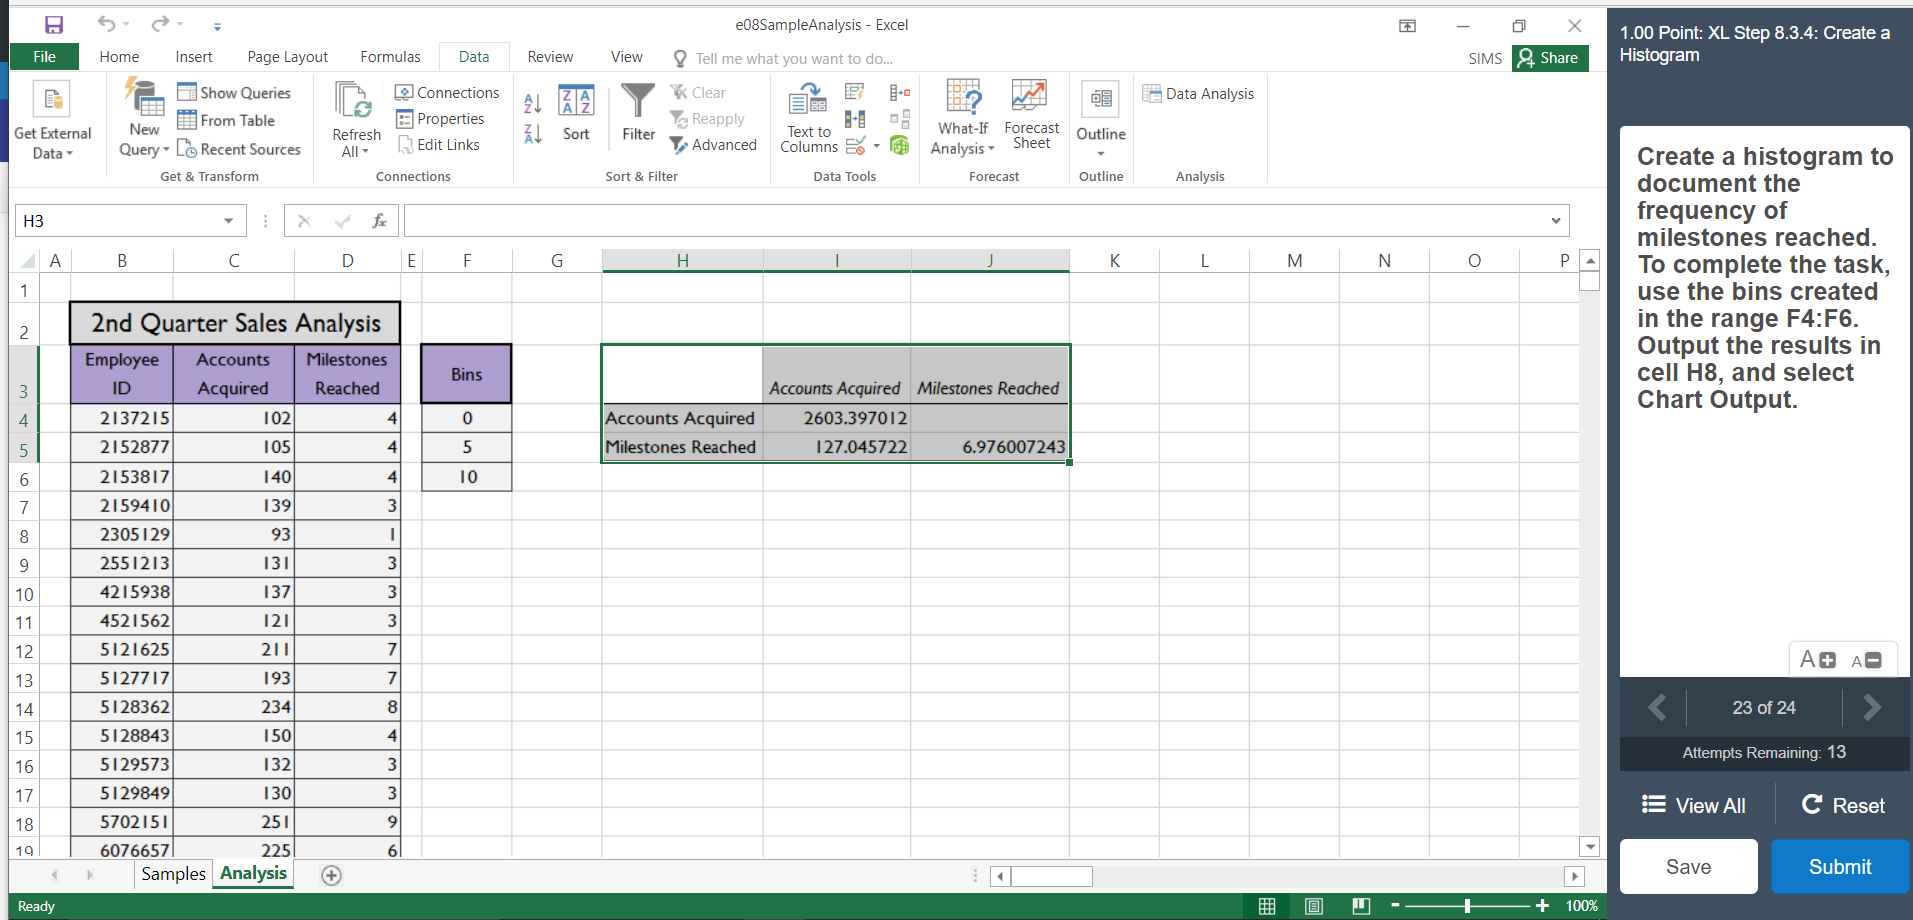
e08SampleAnalysis - Excel 5 Home - O X SIMS 2 Share 1.00 Point: XL Step 8.3.4: Create a Histogram File Insert Page Layout Formulas Data Review View Tell me what you want to do... Show Queries Le Data Analysis Connections Properties New From Table Clear Reapply Advanced Get External Refresh Sort Filter What-If Forecast Outline Data All Edit Links Text to Columns Data Tools Analysis Query- to Recent Sources Get & Transform Sheet Connections Sort & Filter Forecast Outline Analysis A B C D E F G H I J K L M N O P A Create a histogram to document the frequency of milestones reached. To complete the task, use the bins created in the range F4:F6. Output the results in cell H8, and select Chart Output. Bins 102 Accounts Acquired Milestones Reached Accounts Acquired Milestones Reached 2603.397012 127.045722 6.976007243 937 2nd Quarter Sales Analysis Employee Accounts Milestones ID Acquired Reached 2137215 2152877 105 2153817 140 2159410 1 39 2305129 2551213 131 4215938 4521562 121 5121625 211 5127717 5128362 5128843 150 5129573 132 5129849 1301 5702151 251 60766571 2251 Samples Analysis 137) A A A 193) 234 Attempts Remaining: 13 E View All C Reset Save Submit Ready @ - + 100% e08SampleAnalysis - Excel 5 Home - O X SIMS 2 Share 1.00 Point: XL Step 8.3.4: Create a Histogram File Insert Page Layout Formulas Data Review View Tell me what you want to do... Show Queries Le Data Analysis Connections Properties New From Table Clear Reapply Advanced Get External Refresh Sort Filter What-If Forecast Outline Data All Edit Links Text to Columns Data Tools Analysis Query- to Recent Sources Get & Transform Sheet Connections Sort & Filter Forecast Outline Analysis A B C D E F G H I J K L M N O P A Create a histogram to document the frequency of milestones reached. To complete the task, use the bins created in the range F4:F6. Output the results in cell H8, and select Chart Output. Bins 102 Accounts Acquired Milestones Reached Accounts Acquired Milestones Reached 2603.397012 127.045722 6.976007243 937 2nd Quarter Sales Analysis Employee Accounts Milestones ID Acquired Reached 2137215 2152877 105 2153817 140 2159410 1 39 2305129 2551213 131 4215938 4521562 121 5121625 211 5127717 5128362 5128843 150 5129573 132 5129849 1301 5702151 251 60766571 2251 Samples Analysis 137) A A A 193) 234 Attempts Remaining: 13 E View All C Reset Save Submit Ready @ - + 100%
Step by Step Solution
There are 3 Steps involved in it

Get step-by-step solutions from verified subject matter experts