

Question: PR 1 3 - 5 ( LO 1 3 . 5 ) The following heat map results from a sensitivity . - [ The following
PR LO The following heat map results from a sensitivity
The following information applies to the questions displayed below
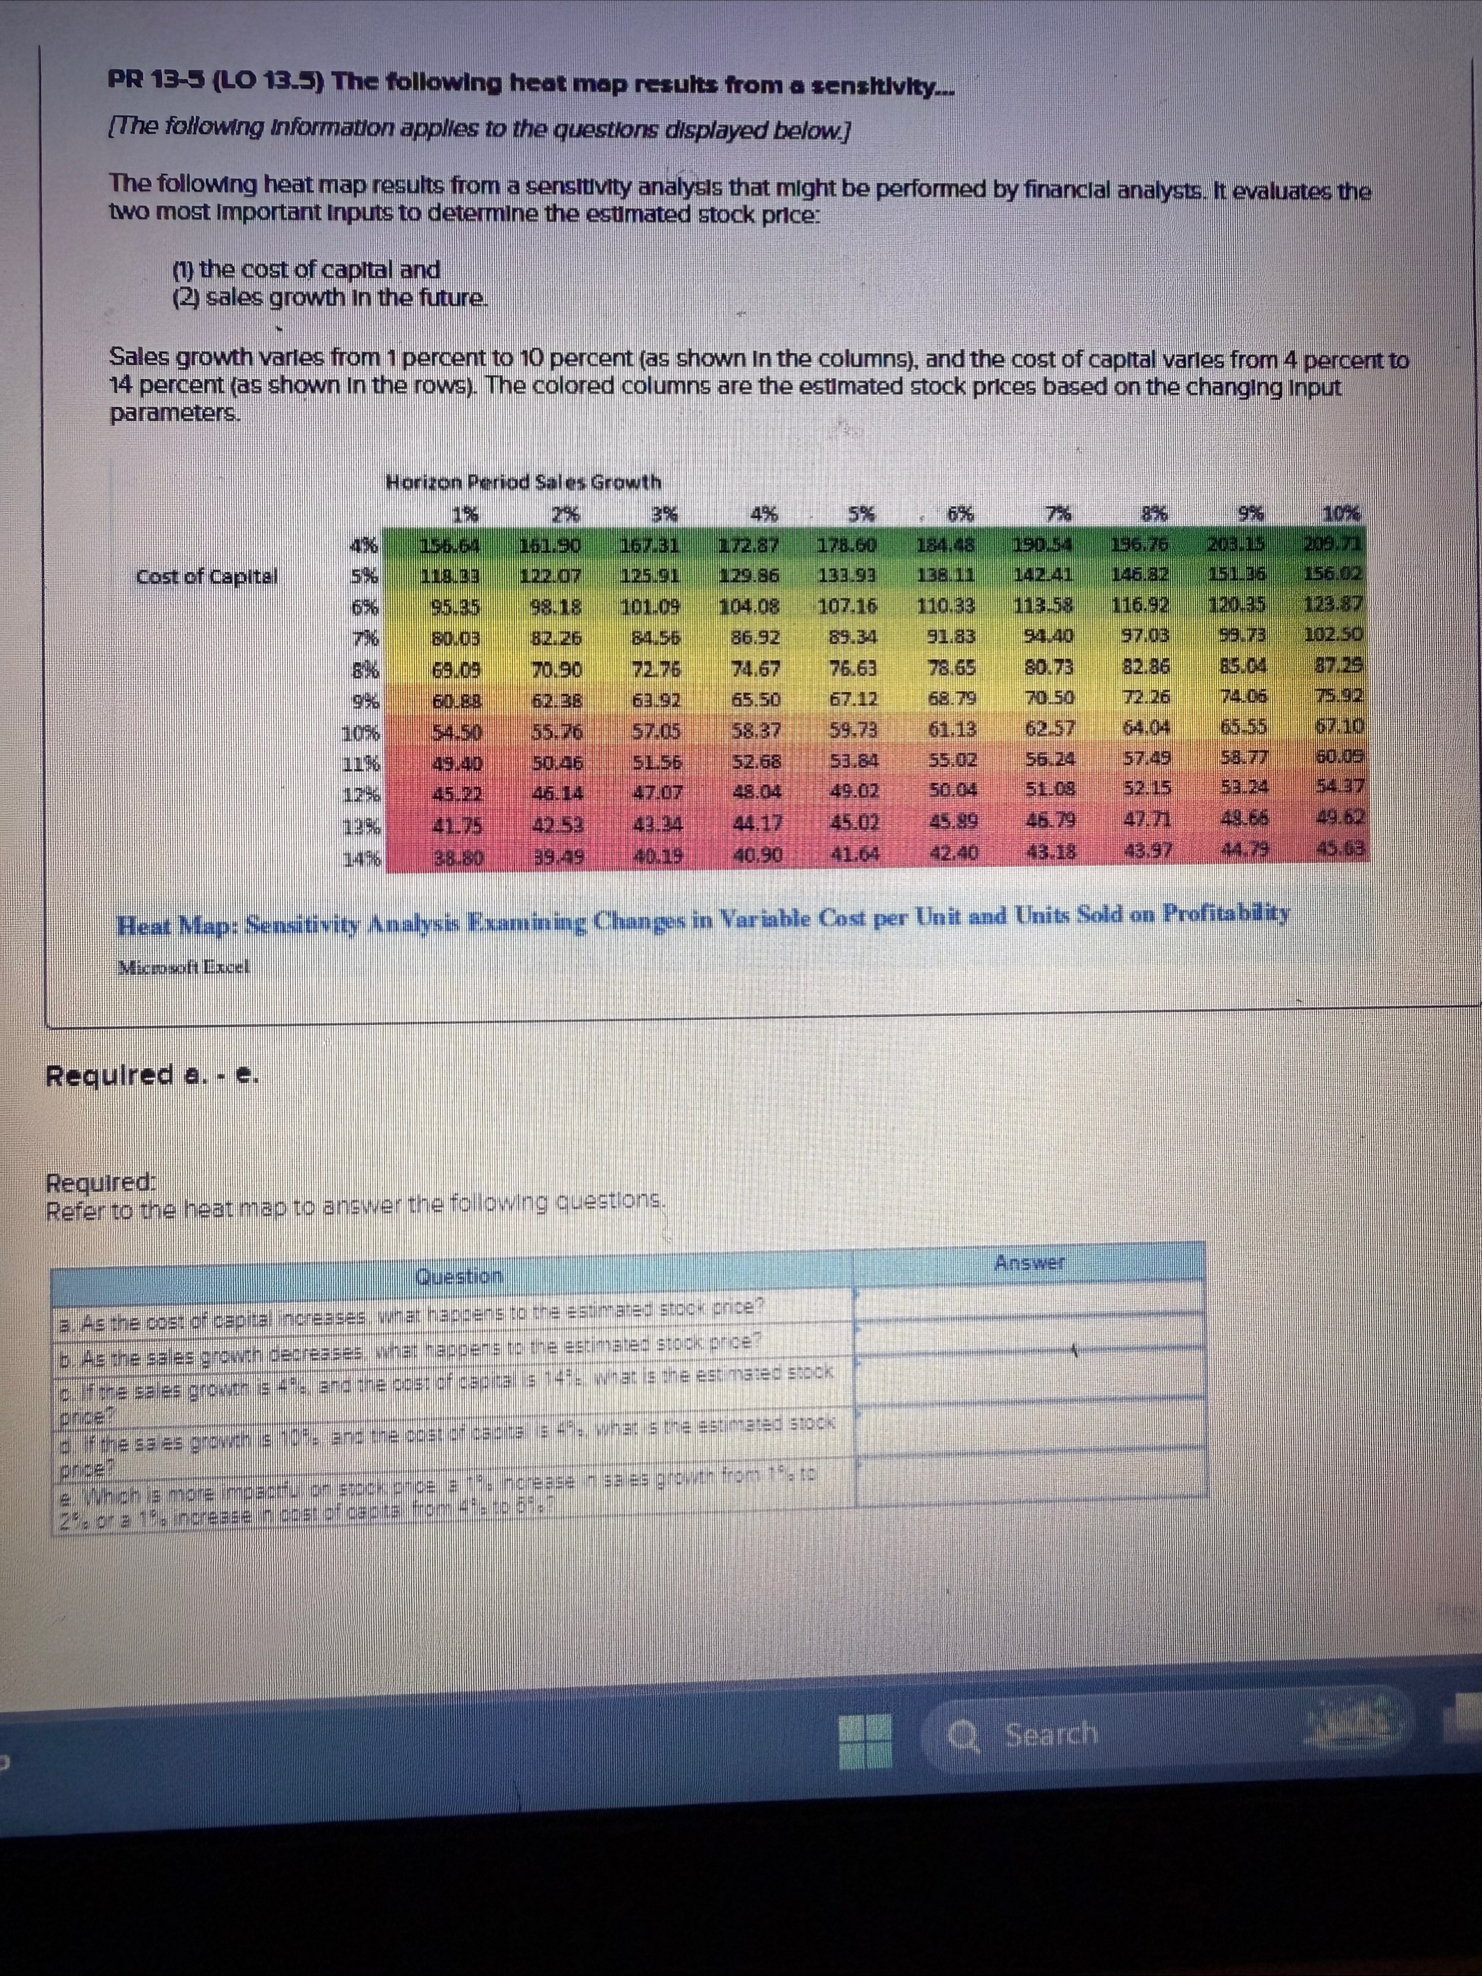
The following heat map results from a sensitivity analysis that might be performed by financial analysts. It evaluates the two most important inputs to determine the estimated stock price:
the cost of capital and
sales growth in the future.
Sales growth varles from percent to percent as shown in the columns and the cost of capital varles from percent to percent as shown in the rows The colored columns are the estimated stock prices based on the changing input parameters.
Heat Map: Sensitivity Analysis Examining Changes in Variable Cost per Unit and Units Sold on Profitability
Microsoff Excel
Required a e
Required:
Refer to the heat map to answer the following questions.
Search
Step by Step Solution
There are 3 Steps involved in it
1 Expert Approved Answer
Step: 1 Unlock

Question Has Been Solved by an Expert!
Get step-by-step solutions from verified subject matter experts
Step: 2 Unlock
Step: 3 Unlock