

Question: Pr . 3 { SEE APPENDIX } ( 2 0 points ) Using the Larson - Miller data for an S - 5 9 0
PrSEE APPENDIX points
Using the LarsonMiller data for an S alloy as shown, predict the time to rupture for a component that is subjected to a stress of MPa at a temperature of degrees Show vour calculations.
Pr points
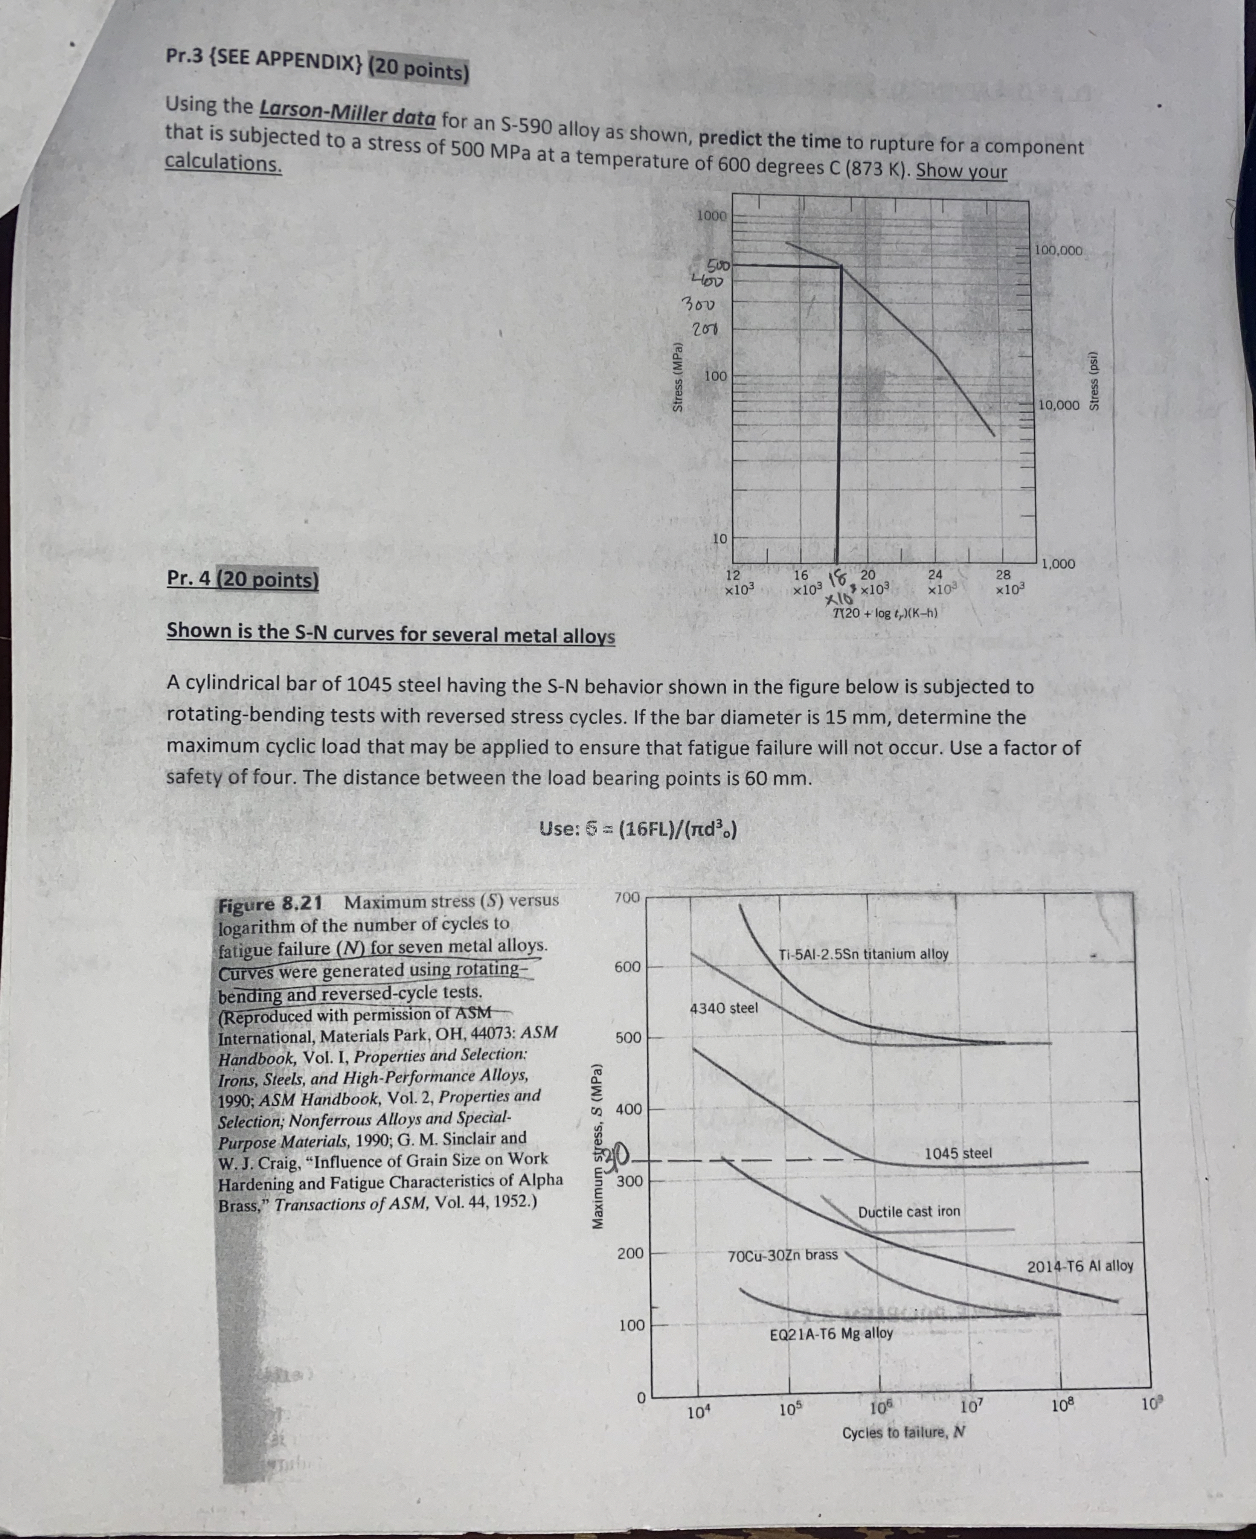
Shown is the SN curves for several metal alloys
A cylindrical bar of steel having the SN behavior shown in the figure below is subjected to rotatingbending tests with reversed stress cycles. If the bar diameter is mm determine the maximum cyclic load that may be applied to ensure that fatigue failure will not occur. Use a factor of safety of four. The distance between the load bearing points is mm
Use:
Figure Maximum stress versus logarithm of the number of cycles to fatigue failure for seven metal alloys. Curves were generated using rotatingbending and reversedcycle tests. Reproduced with permission of ASM International, Materials Park, OH: ASM Handbook, Vol. I, Properties and Selection: Irons, Steels, and HighPerformance Alloys, ; ASM Handbook, Vol. Properties and Selection; Nonferrous Alloys and SpecialPurpose Materials, ; G M Sinclair and W J Craig, "Influence of Grain Size on Work Hardening and Fatigue Characteristics of Alpha Brass," Transactions of ASM, Vol.
Step by Step Solution
There are 3 Steps involved in it
1 Expert Approved Answer
Step: 1 Unlock

Question Has Been Solved by an Expert!
Get step-by-step solutions from verified subject matter experts
Step: 2 Unlock
Step: 3 Unlock