

Practical traders, who believe themselves to be quite exempt from any intellectual influences, are usually slaves...
Fantastic news! We've Found the answer you've been seeking!
Question:
![the adjustment to a new equilibrium. Critically explain this statement using an example.[5 marks] (b) Airbus has a foreign-cu](https://dsd5zvtm8ll6.cloudfront.net/si.experts.images/questions/2021/07/60feb2cdd66a5_1627304650783.jpg)
![(ii) Conduct a cash flow analysis of the money market (iii) hedge.[10 marks] Compare and contrast the cash flow at maturity a](https://dsd5zvtm8ll6.cloudfront.net/si.experts.images/questions/2021/07/60feb2cadb1d2_1627304650597.jpg)
Transcribed Image Text:
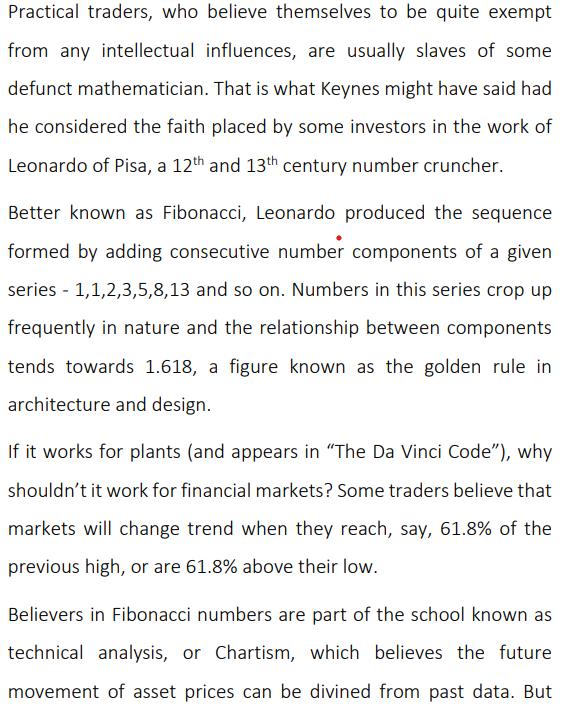
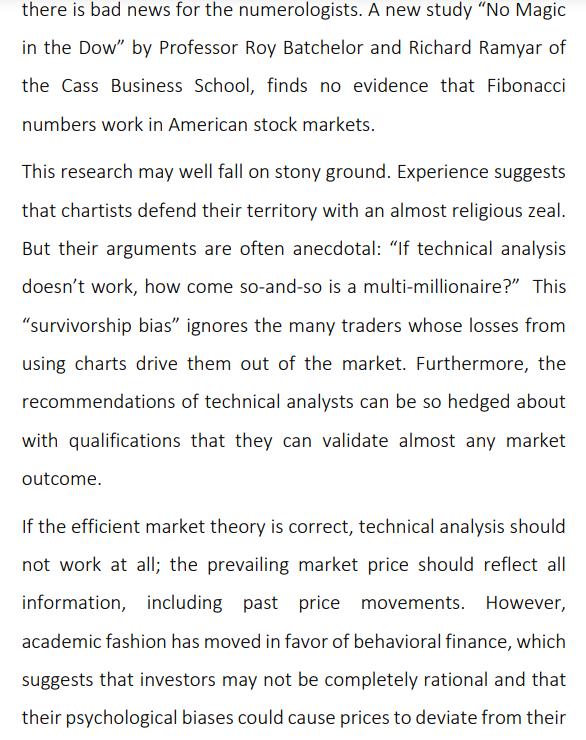
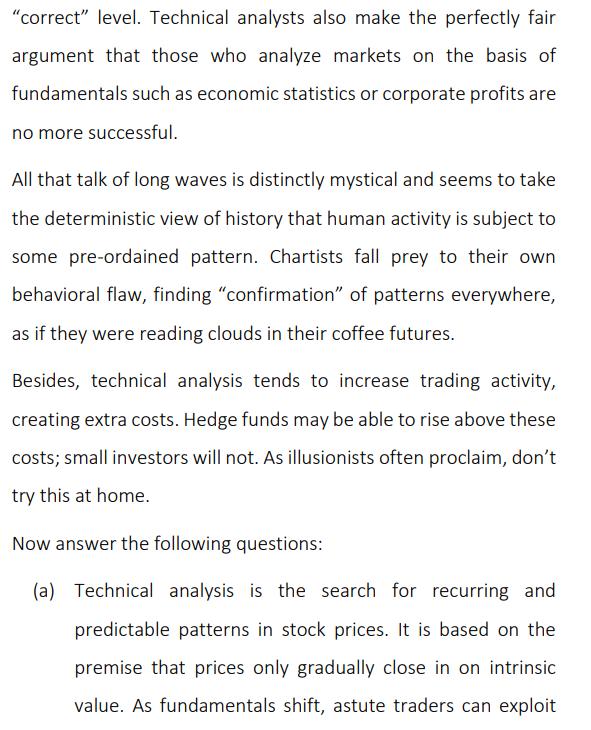
Practical traders, who believe themselves to be quite exempt from any intellectual influences, are usually slaves of some defunct mathematician. That is what Keynes might have said had he considered the faith placed by some investors in the work of Leonardo of Pisa, a 12th and 13th century number cruncher. Better known as Fibonacci, Leonardo produced the sequence formed by adding consecutive number components of a given series - 1,1,2,3,5,8,13 and so on. Numbers in this series crop up frequently in nature and the relationship between components tends towards 1.618, a figure known as the golden rule in architecture and design. If it works for plants (and appears in "The Da Vinci Code"), why shouldn't it work for financial markets? Some traders believe that markets will change trend when they reach, say, 61.8% of the previous high, or are 61.8% above their low. Believers in Fibonacci numbers are part of the school known as technical analysis, or Chartism, which believes the future movement of asset prices can be divined from past data. But there is bad news for the numerologists. A new study "No Magic in the Dow" by Professor Roy Batchelor and Richard Ramyar of the Cass Business School, finds no evidence that Fibonacci numbers work in American stock markets. This research may well fall on stony ground. Experience suggests that chartists defend their territory with an almost religious zeal. But their arguments are often anecdotal: "If technical analysis doesn't work, how come so-and-so is a multi-millionaire?" This "survivorship bias" ignores the many traders whose losses from using charts drive them out of the market. Furthermore, the recommendations of technical analysts can be so hedged about with qualifications that they can validate almost any market outcome. If the efficient market theory is correct, technical analysis should not work at all; the prevailing market price should reflect all information, including past price movements. However, academic fashion has moved in favor of behavioral finance, which suggests that investors may not be completely rational and that their psychological biases could cause prices to deviate from their "correct" level. Technical analysts also make the perfectly fair argument that those who analyze markets on the basis of fundamentals such as economic statistics or corporate profits are no more successful. All that talk of long waves is distinctly mystical and seems to take the deterministic view of history that human activity is subject to some pre-ordained pattern. Chartists fall prey to their own behavioral flaw, finding "confirmation" of patterns everywhere, as if they were reading clouds in their coffee futures. Besides, technical analysis tends to increase trading activity, creating extra costs. Hedge funds may be able to rise above these costs; small investors will not. As illusionists often proclaim, don't try this at home. Now answer the following questions: (a) Technical analysis is the search for recurring and predictable patterns in stock prices. It is based on the premise that prices only gradually close in on intrinsic value. As fundamentals shift, astute traders can exploit the adjustment to a new equilibrium. Critically explain this statement using an example. [5 marks] (b) Airbus has a foreign-currency denominated payable, it can hedge by buying the foreign currency payable forward. The company can expect to eliminate the exposure without incurring costs as long as the forward exchange rate is an unbiased predictor of the future spot rate. Airbus exported an A380 to a UK company, and was billed the sum of £ 12,000,000 payable in three months. Currently the spot rate is $1.40/£ and the three-month forward rate is $1.36/£.The three-month money market interest rate is 12% per annum in US and 8% per annum in UK.So the management of Airbus decided to manage this transaction exposure and use the money market hedge to deal with this pound account payable. (i) Explain how Airbus can eliminate the exchange rate exposure and compute the dollar cost of meeting the pound obligation.[5,5 marks] (ii) (iii) Conduct a cash flow analysis of the money market hedge. [10 marks] Compare and contrast the cash flow at maturity and the net dollar proceeds if instead the options market hedge is used by Airbus. You may assume a put option of £ 12,000,000 with an exercise price of $1.36/£ with a three-month expiration and an option premium of $ 0.05 per £. [10 marks] Practical traders, who believe themselves to be quite exempt from any intellectual influences, are usually slaves of some defunct mathematician. That is what Keynes might have said had he considered the faith placed by some investors in the work of Leonardo of Pisa, a 12th and 13th century number cruncher. Better known as Fibonacci, Leonardo produced the sequence formed by adding consecutive number components of a given series - 1,1,2,3,5,8,13 and so on. Numbers in this series crop up frequently in nature and the relationship between components tends towards 1.618, a figure known as the golden rule in architecture and design. If it works for plants (and appears in "The Da Vinci Code"), why shouldn't it work for financial markets? Some traders believe that markets will change trend when they reach, say, 61.8% of the previous high, or are 61.8% above their low. Believers in Fibonacci numbers are part of the school known as technical analysis, or Chartism, which believes the future movement of asset prices can be divined from past data. But there is bad news for the numerologists. A new study "No Magic in the Dow" by Professor Roy Batchelor and Richard Ramyar of the Cass Business School, finds no evidence that Fibonacci numbers work in American stock markets. This research may well fall on stony ground. Experience suggests that chartists defend their territory with an almost religious zeal. But their arguments are often anecdotal: "If technical analysis doesn't work, how come so-and-so is a multi-millionaire?" This "survivorship bias" ignores the many traders whose losses from using charts drive them out of the market. Furthermore, the recommendations of technical analysts can be so hedged about with qualifications that they can validate almost any market outcome. If the efficient market theory is correct, technical analysis should not work at all; the prevailing market price should reflect all information, including past price movements. However, academic fashion has moved in favor of behavioral finance, which suggests that investors may not be completely rational and that their psychological biases could cause prices to deviate from their "correct" level. Technical analysts also make the perfectly fair argument that those who analyze markets on the basis of fundamentals such as economic statistics or corporate profits are no more successful. All that talk of long waves is distinctly mystical and seems to take the deterministic view of history that human activity is subject to some pre-ordained pattern. Chartists fall prey to their own behavioral flaw, finding "confirmation" of patterns everywhere, as if they were reading clouds in their coffee futures. Besides, technical analysis tends to increase trading activity, creating extra costs. Hedge funds may be able to rise above these costs; small investors will not. As illusionists often proclaim, don't try this at home. Now answer the following questions: (a) Technical analysis is the search for recurring and predictable patterns in stock prices. It is based on the premise that prices only gradually close in on intrinsic value. As fundamentals shift, astute traders can exploit the adjustment to a new equilibrium. Critically explain this statement using an example. [5 marks] (b) Airbus has a foreign-currency denominated payable, it can hedge by buying the foreign currency payable forward. The company can expect to eliminate the exposure without incurring costs as long as the forward exchange rate is an unbiased predictor of the future spot rate. Airbus exported an A380 to a UK company, and was billed the sum of £ 12,000,000 payable in three months. Currently the spot rate is $1.40/£ and the three-month forward rate is $1.36/£.The three-month money market interest rate is 12% per annum in US and 8% per annum in UK.So the management of Airbus decided to manage this transaction exposure and use the money market hedge to deal with this pound account payable. (i) Explain how Airbus can eliminate the exchange rate exposure and compute the dollar cost of meeting the pound obligation.[5,5 marks] (ii) (iii) Conduct a cash flow analysis of the money market hedge. [10 marks] Compare and contrast the cash flow at maturity and the net dollar proceeds if instead the options market hedge is used by Airbus. You may assume a put option of £ 12,000,000 with an exercise price of $1.36/£ with a three-month expiration and an option premium of $ 0.05 per £. [10 marks] Practical traders, who believe themselves to be quite exempt from any intellectual influences, are usually slaves of some defunct mathematician. That is what Keynes might have said had he considered the faith placed by some investors in the work of Leonardo of Pisa, a 12th and 13th century number cruncher. Better known as Fibonacci, Leonardo produced the sequence formed by adding consecutive number components of a given series - 1,1,2,3,5,8,13 and so on. Numbers in this series crop up frequently in nature and the relationship between components tends towards 1.618, a figure known as the golden rule in architecture and design. If it works for plants (and appears in "The Da Vinci Code"), why shouldn't it work for financial markets? Some traders believe that markets will change trend when they reach, say, 61.8% of the previous high, or are 61.8% above their low. Believers in Fibonacci numbers are part of the school known as technical analysis, or Chartism, which believes the future movement of asset prices can be divined from past data. But there is bad news for the numerologists. A new study "No Magic in the Dow" by Professor Roy Batchelor and Richard Ramyar of the Cass Business School, finds no evidence that Fibonacci numbers work in American stock markets. This research may well fall on stony ground. Experience suggests that chartists defend their territory with an almost religious zeal. But their arguments are often anecdotal: "If technical analysis doesn't work, how come so-and-so is a multi-millionaire?" This "survivorship bias" ignores the many traders whose losses from using charts drive them out of the market. Furthermore, the recommendations of technical analysts can be so hedged about with qualifications that they can validate almost any market outcome. If the efficient market theory is correct, technical analysis should not work at all; the prevailing market price should reflect all information, including past price movements. However, academic fashion has moved in favor of behavioral finance, which suggests that investors may not be completely rational and that their psychological biases could cause prices to deviate from their "correct" level. Technical analysts also make the perfectly fair argument that those who analyze markets on the basis of fundamentals such as economic statistics or corporate profits are no more successful. All that talk of long waves is distinctly mystical and seems to take the deterministic view of history that human activity is subject to some pre-ordained pattern. Chartists fall prey to their own behavioral flaw, finding "confirmation" of patterns everywhere, as if they were reading clouds in their coffee futures. Besides, technical analysis tends to increase trading activity, creating extra costs. Hedge funds may be able to rise above these costs; small investors will not. As illusionists often proclaim, don't try this at home. Now answer the following questions: (a) Technical analysis is the search for recurring and predictable patterns in stock prices. It is based on the premise that prices only gradually close in on intrinsic value. As fundamentals shift, astute traders can exploit the adjustment to a new equilibrium. Critically explain this statement using an example. [5 marks] (b) Airbus has a foreign-currency denominated payable, it can hedge by buying the foreign currency payable forward. The company can expect to eliminate the exposure without incurring costs as long as the forward exchange rate is an unbiased predictor of the future spot rate. Airbus exported an A380 to a UK company, and was billed the sum of £ 12,000,000 payable in three months. Currently the spot rate is $1.40/£ and the three-month forward rate is $1.36/£.The three-month money market interest rate is 12% per annum in US and 8% per annum in UK.So the management of Airbus decided to manage this transaction exposure and use the money market hedge to deal with this pound account payable. (i) Explain how Airbus can eliminate the exchange rate exposure and compute the dollar cost of meeting the pound obligation.[5,5 marks] (ii) (iii) Conduct a cash flow analysis of the money market hedge. [10 marks] Compare and contrast the cash flow at maturity and the net dollar proceeds if instead the options market hedge is used by Airbus. You may assume a put option of £ 12,000,000 with an exercise price of $1.36/£ with a three-month expiration and an option premium of $ 0.05 per £. [10 marks] Practical traders, who believe themselves to be quite exempt from any intellectual influences, are usually slaves of some defunct mathematician. That is what Keynes might have said had he considered the faith placed by some investors in the work of Leonardo of Pisa, a 12th and 13th century number cruncher. Better known as Fibonacci, Leonardo produced the sequence formed by adding consecutive number components of a given series - 1,1,2,3,5,8,13 and so on. Numbers in this series crop up frequently in nature and the relationship between components tends towards 1.618, a figure known as the golden rule in architecture and design. If it works for plants (and appears in "The Da Vinci Code"), why shouldn't it work for financial markets? Some traders believe that markets will change trend when they reach, say, 61.8% of the previous high, or are 61.8% above their low. Believers in Fibonacci numbers are part of the school known as technical analysis, or Chartism, which believes the future movement of asset prices can be divined from past data. But there is bad news for the numerologists. A new study "No Magic in the Dow" by Professor Roy Batchelor and Richard Ramyar of the Cass Business School, finds no evidence that Fibonacci numbers work in American stock markets. This research may well fall on stony ground. Experience suggests that chartists defend their territory with an almost religious zeal. But their arguments are often anecdotal: "If technical analysis doesn't work, how come so-and-so is a multi-millionaire?" This "survivorship bias" ignores the many traders whose losses from using charts drive them out of the market. Furthermore, the recommendations of technical analysts can be so hedged about with qualifications that they can validate almost any market outcome. If the efficient market theory is correct, technical analysis should not work at all; the prevailing market price should reflect all information, including past price movements. However, academic fashion has moved in favor of behavioral finance, which suggests that investors may not be completely rational and that their psychological biases could cause prices to deviate from their "correct" level. Technical analysts also make the perfectly fair argument that those who analyze markets on the basis of fundamentals such as economic statistics or corporate profits are no more successful. All that talk of long waves is distinctly mystical and seems to take the deterministic view of history that human activity is subject to some pre-ordained pattern. Chartists fall prey to their own behavioral flaw, finding "confirmation" of patterns everywhere, as if they were reading clouds in their coffee futures. Besides, technical analysis tends to increase trading activity, creating extra costs. Hedge funds may be able to rise above these costs; small investors will not. As illusionists often proclaim, don't try this at home. Now answer the following questions: (a) Technical analysis is the search for recurring and predictable patterns in stock prices. It is based on the premise that prices only gradually close in on intrinsic value. As fundamentals shift, astute traders can exploit the adjustment to a new equilibrium. Critically explain this statement using an example. [5 marks] (b) Airbus has a foreign-currency denominated payable, it can hedge by buying the foreign currency payable forward. The company can expect to eliminate the exposure without incurring costs as long as the forward exchange rate is an unbiased predictor of the future spot rate. Airbus exported an A380 to a UK company, and was billed the sum of £ 12,000,000 payable in three months. Currently the spot rate is $1.40/£ and the three-month forward rate is $1.36/£.The three-month money market interest rate is 12% per annum in US and 8% per annum in UK.So the management of Airbus decided to manage this transaction exposure and use the money market hedge to deal with this pound account payable. (i) Explain how Airbus can eliminate the exchange rate exposure and compute the dollar cost of meeting the pound obligation.[5,5 marks] (ii) (iii) Conduct a cash flow analysis of the money market hedge. [10 marks] Compare and contrast the cash flow at maturity and the net dollar proceeds if instead the options market hedge is used by Airbus. You may assume a put option of £ 12,000,000 with an exercise price of $1.36/£ with a three-month expiration and an option premium of $ 0.05 per £. [10 marks] Practical traders, who believe themselves to be quite exempt from any intellectual influences, are usually slaves of some defunct mathematician. That is what Keynes might have said had he considered the faith placed by some investors in the work of Leonardo of Pisa, a 12th and 13th century number cruncher. Better known as Fibonacci, Leonardo produced the sequence formed by adding consecutive number components of a given series - 1,1,2,3,5,8,13 and so on. Numbers in this series crop up frequently in nature and the relationship between components tends towards 1.618, a figure known as the golden rule in architecture and design. If it works for plants (and appears in "The Da Vinci Code"), why shouldn't it work for financial markets? Some traders believe that markets will change trend when they reach, say, 61.8% of the previous high, or are 61.8% above their low. Believers in Fibonacci numbers are part of the school known as technical analysis, or Chartism, which believes the future movement of asset prices can be divined from past data. But there is bad news for the numerologists. A new study "No Magic in the Dow" by Professor Roy Batchelor and Richard Ramyar of the Cass Business School, finds no evidence that Fibonacci numbers work in American stock markets. This research may well fall on stony ground. Experience suggests that chartists defend their territory with an almost religious zeal. But their arguments are often anecdotal: "If technical analysis doesn't work, how come so-and-so is a multi-millionaire?" This "survivorship bias" ignores the many traders whose losses from using charts drive them out of the market. Furthermore, the recommendations of technical analysts can be so hedged about with qualifications that they can validate almost any market outcome. If the efficient market theory is correct, technical analysis should not work at all; the prevailing market price should reflect all information, including past price movements. However, academic fashion has moved in favor of behavioral finance, which suggests that investors may not be completely rational and that their psychological biases could cause prices to deviate from their "correct" level. Technical analysts also make the perfectly fair argument that those who analyze markets on the basis of fundamentals such as economic statistics or corporate profits are no more successful. All that talk of long waves is distinctly mystical and seems to take the deterministic view of history that human activity is subject to some pre-ordained pattern. Chartists fall prey to their own behavioral flaw, finding "confirmation" of patterns everywhere, as if they were reading clouds in their coffee futures. Besides, technical analysis tends to increase trading activity, creating extra costs. Hedge funds may be able to rise above these costs; small investors will not. As illusionists often proclaim, don't try this at home. Now answer the following questions: (a) Technical analysis is the search for recurring and predictable patterns in stock prices. It is based on the premise that prices only gradually close in on intrinsic value. As fundamentals shift, astute traders can exploit the adjustment to a new equilibrium. Critically explain this statement using an example. [5 marks] (b) Airbus has a foreign-currency denominated payable, it can hedge by buying the foreign currency payable forward. The company can expect to eliminate the exposure without incurring costs as long as the forward exchange rate is an unbiased predictor of the future spot rate. Airbus exported an A380 to a UK company, and was billed the sum of £ 12,000,000 payable in three months. Currently the spot rate is $1.40/£ and the three-month forward rate is $1.36/£.The three-month money market interest rate is 12% per annum in US and 8% per annum in UK.So the management of Airbus decided to manage this transaction exposure and use the money market hedge to deal with this pound account payable. (i) Explain how Airbus can eliminate the exchange rate exposure and compute the dollar cost of meeting the pound obligation.[5,5 marks] (ii) (iii) Conduct a cash flow analysis of the money market hedge. [10 marks] Compare and contrast the cash flow at maturity and the net dollar proceeds if instead the options market hedge is used by Airbus. You may assume a put option of £ 12,000,000 with an exercise price of $1.36/£ with a three-month expiration and an option premium of $ 0.05 per £. [10 marks] Practical traders, who believe themselves to be quite exempt from any intellectual influences, are usually slaves of some defunct mathematician. That is what Keynes might have said had he considered the faith placed by some investors in the work of Leonardo of Pisa, a 12th and 13th century number cruncher. Better known as Fibonacci, Leonardo produced the sequence formed by adding consecutive number components of a given series - 1,1,2,3,5,8,13 and so on. Numbers in this series crop up frequently in nature and the relationship between components tends towards 1.618, a figure known as the golden rule in architecture and design. If it works for plants (and appears in "The Da Vinci Code"), why shouldn't it work for financial markets? Some traders believe that markets will change trend when they reach, say, 61.8% of the previous high, or are 61.8% above their low. Believers in Fibonacci numbers are part of the school known as technical analysis, or Chartism, which believes the future movement of asset prices can be divined from past data. But there is bad news for the numerologists. A new study "No Magic in the Dow" by Professor Roy Batchelor and Richard Ramyar of the Cass Business School, finds no evidence that Fibonacci numbers work in American stock markets. This research may well fall on stony ground. Experience suggests that chartists defend their territory with an almost religious zeal. But their arguments are often anecdotal: "If technical analysis doesn't work, how come so-and-so is a multi-millionaire?" This "survivorship bias" ignores the many traders whose losses from using charts drive them out of the market. Furthermore, the recommendations of technical analysts can be so hedged about with qualifications that they can validate almost any market outcome. If the efficient market theory is correct, technical analysis should not work at all; the prevailing market price should reflect all information, including past price movements. However, academic fashion has moved in favor of behavioral finance, which suggests that investors may not be completely rational and that their psychological biases could cause prices to deviate from their "correct" level. Technical analysts also make the perfectly fair argument that those who analyze markets on the basis of fundamentals such as economic statistics or corporate profits are no more successful. All that talk of long waves is distinctly mystical and seems to take the deterministic view of history that human activity is subject to some pre-ordained pattern. Chartists fall prey to their own behavioral flaw, finding "confirmation" of patterns everywhere, as if they were reading clouds in their coffee futures. Besides, technical analysis tends to increase trading activity, creating extra costs. Hedge funds may be able to rise above these costs; small investors will not. As illusionists often proclaim, don't try this at home. Now answer the following questions: (a) Technical analysis is the search for recurring and predictable patterns in stock prices. It is based on the premise that prices only gradually close in on intrinsic value. As fundamentals shift, astute traders can exploit the adjustment to a new equilibrium. Critically explain this statement using an example. [5 marks] (b) Airbus has a foreign-currency denominated payable, it can hedge by buying the foreign currency payable forward. The company can expect to eliminate the exposure without incurring costs as long as the forward exchange rate is an unbiased predictor of the future spot rate. Airbus exported an A380 to a UK company, and was billed the sum of £ 12,000,000 payable in three months. Currently the spot rate is $1.40/£ and the three-month forward rate is $1.36/£.The three-month money market interest rate is 12% per annum in US and 8% per annum in UK.So the management of Airbus decided to manage this transaction exposure and use the money market hedge to deal with this pound account payable. (i) Explain how Airbus can eliminate the exchange rate exposure and compute the dollar cost of meeting the pound obligation.[5,5 marks] (ii) (iii) Conduct a cash flow analysis of the money market hedge. [10 marks] Compare and contrast the cash flow at maturity and the net dollar proceeds if instead the options market hedge is used by Airbus. You may assume a put option of £ 12,000,000 with an exercise price of $1.36/£ with a three-month expiration and an option premium of $ 0.05 per £. [10 marks] Practical traders, who believe themselves to be quite exempt from any intellectual influences, are usually slaves of some defunct mathematician. That is what Keynes might have said had he considered the faith placed by some investors in the work of Leonardo of Pisa, a 12th and 13th century number cruncher. Better known as Fibonacci, Leonardo produced the sequence formed by adding consecutive number components of a given series - 1,1,2,3,5,8,13 and so on. Numbers in this series crop up frequently in nature and the relationship between components tends towards 1.618, a figure known as the golden rule in architecture and design. If it works for plants (and appears in "The Da Vinci Code"), why shouldn't it work for financial markets? Some traders believe that markets will change trend when they reach, say, 61.8% of the previous high, or are 61.8% above their low. Believers in Fibonacci numbers are part of the school known as technical analysis, or Chartism, which believes the future movement of asset prices can be divined from past data. But there is bad news for the numerologists. A new study "No Magic in the Dow" by Professor Roy Batchelor and Richard Ramyar of the Cass Business School, finds no evidence that Fibonacci numbers work in American stock markets. This research may well fall on stony ground. Experience suggests that chartists defend their territory with an almost religious zeal. But their arguments are often anecdotal: "If technical analysis doesn't work, how come so-and-so is a multi-millionaire?" This "survivorship bias" ignores the many traders whose losses from using charts drive them out of the market. Furthermore, the recommendations of technical analysts can be so hedged about with qualifications that they can validate almost any market outcome. If the efficient market theory is correct, technical analysis should not work at all; the prevailing market price should reflect all information, including past price movements. However, academic fashion has moved in favor of behavioral finance, which suggests that investors may not be completely rational and that their psychological biases could cause prices to deviate from their "correct" level. Technical analysts also make the perfectly fair argument that those who analyze markets on the basis of fundamentals such as economic statistics or corporate profits are no more successful. All that talk of long waves is distinctly mystical and seems to take the deterministic view of history that human activity is subject to some pre-ordained pattern. Chartists fall prey to their own behavioral flaw, finding "confirmation" of patterns everywhere, as if they were reading clouds in their coffee futures. Besides, technical analysis tends to increase trading activity, creating extra costs. Hedge funds may be able to rise above these costs; small investors will not. As illusionists often proclaim, don't try this at home. Now answer the following questions: (a) Technical analysis is the search for recurring and predictable patterns in stock prices. It is based on the premise that prices only gradually close in on intrinsic value. As fundamentals shift, astute traders can exploit the adjustment to a new equilibrium. Critically explain this statement using an example. [5 marks] (b) Airbus has a foreign-currency denominated payable, it can hedge by buying the foreign currency payable forward. The company can expect to eliminate the exposure without incurring costs as long as the forward exchange rate is an unbiased predictor of the future spot rate. Airbus exported an A380 to a UK company, and was billed the sum of £ 12,000,000 payable in three months. Currently the spot rate is $1.40/£ and the three-month forward rate is $1.36/£.The three-month money market interest rate is 12% per annum in US and 8% per annum in UK.So the management of Airbus decided to manage this transaction exposure and use the money market hedge to deal with this pound account payable. (i) Explain how Airbus can eliminate the exchange rate exposure and compute the dollar cost of meeting the pound obligation.[5,5 marks] (ii) (iii) Conduct a cash flow analysis of the money market hedge. [10 marks] Compare and contrast the cash flow at maturity and the net dollar proceeds if instead the options market hedge is used by Airbus. You may assume a put option of £ 12,000,000 with an exercise price of $1.36/£ with a three-month expiration and an option premium of $ 0.05 per £. [10 marks] Practical traders, who believe themselves to be quite exempt from any intellectual influences, are usually slaves of some defunct mathematician. That is what Keynes might have said had he considered the faith placed by some investors in the work of Leonardo of Pisa, a 12th and 13th century number cruncher. Better known as Fibonacci, Leonardo produced the sequence formed by adding consecutive number components of a given series - 1,1,2,3,5,8,13 and so on. Numbers in this series crop up frequently in nature and the relationship between components tends towards 1.618, a figure known as the golden rule in architecture and design. If it works for plants (and appears in "The Da Vinci Code"), why shouldn't it work for financial markets? Some traders believe that markets will change trend when they reach, say, 61.8% of the previous high, or are 61.8% above their low. Believers in Fibonacci numbers are part of the school known as technical analysis, or Chartism, which believes the future movement of asset prices can be divined from past data. But there is bad news for the numerologists. A new study "No Magic in the Dow" by Professor Roy Batchelor and Richard Ramyar of the Cass Business School, finds no evidence that Fibonacci numbers work in American stock markets. This research may well fall on stony ground. Experience suggests that chartists defend their territory with an almost religious zeal. But their arguments are often anecdotal: "If technical analysis doesn't work, how come so-and-so is a multi-millionaire?" This "survivorship bias" ignores the many traders whose losses from using charts drive them out of the market. Furthermore, the recommendations of technical analysts can be so hedged about with qualifications that they can validate almost any market outcome. If the efficient market theory is correct, technical analysis should not work at all; the prevailing market price should reflect all information, including past price movements. However, academic fashion has moved in favor of behavioral finance, which suggests that investors may not be completely rational and that their psychological biases could cause prices to deviate from their "correct" level. Technical analysts also make the perfectly fair argument that those who analyze markets on the basis of fundamentals such as economic statistics or corporate profits are no more successful. All that talk of long waves is distinctly mystical and seems to take the deterministic view of history that human activity is subject to some pre-ordained pattern. Chartists fall prey to their own behavioral flaw, finding "confirmation" of patterns everywhere, as if they were reading clouds in their coffee futures. Besides, technical analysis tends to increase trading activity, creating extra costs. Hedge funds may be able to rise above these costs; small investors will not. As illusionists often proclaim, don't try this at home. Now answer the following questions: (a) Technical analysis is the search for recurring and predictable patterns in stock prices. It is based on the premise that prices only gradually close in on intrinsic value. As fundamentals shift, astute traders can exploit the adjustment to a new equilibrium. Critically explain this statement using an example. [5 marks] (b) Airbus has a foreign-currency denominated payable, it can hedge by buying the foreign currency payable forward. The company can expect to eliminate the exposure without incurring costs as long as the forward exchange rate is an unbiased predictor of the future spot rate. Airbus exported an A380 to a UK company, and was billed the sum of £ 12,000,000 payable in three months. Currently the spot rate is $1.40/£ and the three-month forward rate is $1.36/£.The three-month money market interest rate is 12% per annum in US and 8% per annum in UK.So the management of Airbus decided to manage this transaction exposure and use the money market hedge to deal with this pound account payable. (i) Explain how Airbus can eliminate the exchange rate exposure and compute the dollar cost of meeting the pound obligation.[5,5 marks] (ii) (iii) Conduct a cash flow analysis of the money market hedge. [10 marks] Compare and contrast the cash flow at maturity and the net dollar proceeds if instead the options market hedge is used by Airbus. You may assume a put option of £ 12,000,000 with an exercise price of $1.36/£ with a three-month expiration and an option premium of $ 0.05 per £. [10 marks] Practical traders, who believe themselves to be quite exempt from any intellectual influences, are usually slaves of some defunct mathematician. That is what Keynes might have said had he considered the faith placed by some investors in the work of Leonardo of Pisa, a 12th and 13th century number cruncher. Better known as Fibonacci, Leonardo produced the sequence formed by adding consecutive number components of a given series - 1,1,2,3,5,8,13 and so on. Numbers in this series crop up frequently in nature and the relationship between components tends towards 1.618, a figure known as the golden rule in architecture and design. If it works for plants (and appears in "The Da Vinci Code"), why shouldn't it work for financial markets? Some traders believe that markets will change trend when they reach, say, 61.8% of the previous high, or are 61.8% above their low. Believers in Fibonacci numbers are part of the school known as technical analysis, or Chartism, which believes the future movement of asset prices can be divined from past data. But there is bad news for the numerologists. A new study "No Magic in the Dow" by Professor Roy Batchelor and Richard Ramyar of the Cass Business School, finds no evidence that Fibonacci numbers work in American stock markets. This research may well fall on stony ground. Experience suggests that chartists defend their territory with an almost religious zeal. But their arguments are often anecdotal: "If technical analysis doesn't work, how come so-and-so is a multi-millionaire?" This "survivorship bias" ignores the many traders whose losses from using charts drive them out of the market. Furthermore, the recommendations of technical analysts can be so hedged about with qualifications that they can validate almost any market outcome. If the efficient market theory is correct, technical analysis should not work at all; the prevailing market price should reflect all information, including past price movements. However, academic fashion has moved in favor of behavioral finance, which suggests that investors may not be completely rational and that their psychological biases could cause prices to deviate from their "correct" level. Technical analysts also make the perfectly fair argument that those who analyze markets on the basis of fundamentals such as economic statistics or corporate profits are no more successful. All that talk of long waves is distinctly mystical and seems to take the deterministic view of history that human activity is subject to some pre-ordained pattern. Chartists fall prey to their own behavioral flaw, finding "confirmation" of patterns everywhere, as if they were reading clouds in their coffee futures. Besides, technical analysis tends to increase trading activity, creating extra costs. Hedge funds may be able to rise above these costs; small investors will not. As illusionists often proclaim, don't try this at home. Now answer the following questions: (a) Technical analysis is the search for recurring and predictable patterns in stock prices. It is based on the premise that prices only gradually close in on intrinsic value. As fundamentals shift, astute traders can exploit the adjustment to a new equilibrium. Critically explain this statement using an example. [5 marks] (b) Airbus has a foreign-currency denominated payable, it can hedge by buying the foreign currency payable forward. The company can expect to eliminate the exposure without incurring costs as long as the forward exchange rate is an unbiased predictor of the future spot rate. Airbus exported an A380 to a UK company, and was billed the sum of £ 12,000,000 payable in three months. Currently the spot rate is $1.40/£ and the three-month forward rate is $1.36/£.The three-month money market interest rate is 12% per annum in US and 8% per annum in UK.So the management of Airbus decided to manage this transaction exposure and use the money market hedge to deal with this pound account payable. (i) Explain how Airbus can eliminate the exchange rate exposure and compute the dollar cost of meeting the pound obligation.[5,5 marks] (ii) (iii) Conduct a cash flow analysis of the money market hedge. [10 marks] Compare and contrast the cash flow at maturity and the net dollar proceeds if instead the options market hedge is used by Airbus. You may assume a put option of £ 12,000,000 with an exercise price of $1.36/£ with a three-month expiration and an option premium of $ 0.05 per £. [10 marks] Practical traders, who believe themselves to be quite exempt from any intellectual influences, are usually slaves of some defunct mathematician. That is what Keynes might have said had he considered the faith placed by some investors in the work of Leonardo of Pisa, a 12th and 13th century number cruncher. Better known as Fibonacci, Leonardo produced the sequence formed by adding consecutive number components of a given series - 1,1,2,3,5,8,13 and so on. Numbers in this series crop up frequently in nature and the relationship between components tends towards 1.618, a figure known as the golden rule in architecture and design. If it works for plants (and appears in "The Da Vinci Code"), why shouldn't it work for financial markets? Some traders believe that markets will change trend when they reach, say, 61.8% of the previous high, or are 61.8% above their low. Believers in Fibonacci numbers are part of the school known as technical analysis, or Chartism, which believes the future movement of asset prices can be divined from past data. But there is bad news for the numerologists. A new study "No Magic in the Dow" by Professor Roy Batchelor and Richard Ramyar of the Cass Business School, finds no evidence that Fibonacci numbers work in American stock markets. This research may well fall on stony ground. Experience suggests that chartists defend their territory with an almost religious zeal. But their arguments are often anecdotal: "If technical analysis doesn't work, how come so-and-so is a multi-millionaire?" This "survivorship bias" ignores the many traders whose losses from using charts drive them out of the market. Furthermore, the recommendations of technical analysts can be so hedged about with qualifications that they can validate almost any market outcome. If the efficient market theory is correct, technical analysis should not work at all; the prevailing market price should reflect all information, including past price movements. However, academic fashion has moved in favor of behavioral finance, which suggests that investors may not be completely rational and that their psychological biases could cause prices to deviate from their "correct" level. Technical analysts also make the perfectly fair argument that those who analyze markets on the basis of fundamentals such as economic statistics or corporate profits are no more successful. All that talk of long waves is distinctly mystical and seems to take the deterministic view of history that human activity is subject to some pre-ordained pattern. Chartists fall prey to their own behavioral flaw, finding "confirmation" of patterns everywhere, as if they were reading clouds in their coffee futures. Besides, technical analysis tends to increase trading activity, creating extra costs. Hedge funds may be able to rise above these costs; small investors will not. As illusionists often proclaim, don't try this at home. Now answer the following questions: (a) Technical analysis is the search for recurring and predictable patterns in stock prices. It is based on the premise that prices only gradually close in on intrinsic value. As fundamentals shift, astute traders can exploit the adjustment to a new equilibrium. Critically explain this statement using an example. [5 marks] (b) Airbus has a foreign-currency denominated payable, it can hedge by buying the foreign currency payable forward. The company can expect to eliminate the exposure without incurring costs as long as the forward exchange rate is an unbiased predictor of the future spot rate. Airbus exported an A380 to a UK company, and was billed the sum of £ 12,000,000 payable in three months. Currently the spot rate is $1.40/£ and the three-month forward rate is $1.36/£.The three-month money market interest rate is 12% per annum in US and 8% per annum in UK.So the management of Airbus decided to manage this transaction exposure and use the money market hedge to deal with this pound account payable. (i) Explain how Airbus can eliminate the exchange rate exposure and compute the dollar cost of meeting the pound obligation.[5,5 marks] (ii) (iii) Conduct a cash flow analysis of the money market hedge. [10 marks] Compare and contrast the cash flow at maturity and the net dollar proceeds if instead the options market hedge is used by Airbus. You may assume a put option of £ 12,000,000 with an exercise price of $1.36/£ with a three-month expiration and an option premium of $ 0.05 per £. [10 marks]
Expert Answer:
Answer rating: 100% (QA)
Technical analysis is the search for recurring and predictable patterns in stock prices It is based ... View the full answer

Related Book For 
Posted Date:
Students also viewed these accounting questions
-
Leonardo da Vinci (1452-1519) drew a sketch of a man, indicating that a person's armspan (measuring across the back with arms outstretched to make a "T") is roughly equal to the person's height. To...
-
Leonardo da Vinci (1452-1519) drew a sketch of a man, indicating that a person's arm span (measuring across the back with your arms outstretched to make a "T") is roughly equal to the person's...
-
A famous sequence {fn}, called the Fibonacci Sequence after Leonardo Fibonacci, who introduced it around A.D. 1200, is defined by the recursion formula f1 = f2 = 1, fn+2 = fn+1 + fn (a) Find .13...
-
Different theories about early childhood inform approaches to children's learning and development. Early childhood educators draw upon a range of perspectives in their work ..." (EYLF p.12)....
-
The following data represent a random sample of end-of-year bonuses for the lower-level managerial personnel employed by a large firm. Bonuses are expressed in percentage of yearly salary. Construct...
-
What is a distributed database system?
-
A beetle that has an inertia of \(4.0 \times 10^{-6} \mathrm{~kg}\) sits on the floor. It jumps by using its muscles to push against the floor and raise its center of mass. (a) If its center of mass...
-
On December 31, 2016, Robey Company accumulated the following information for 2016 in regard to its defined benefit pension plan: Service cost ................ $ 105,000 Interest cost on projected...
-
Why is it important for a risk indicator to not be costly to collect?
-
The following table summarizes the operating results for Bene Petits first year of operations: Bene Petit First year operating data: Single (1 serving) Dual (2 servings) Family (4 servings) Total...
-
Statement of Cash FlowsIndirect Method The comparative balance sheet of Livers Inc. for December 31, 20Y3 and 20Y2, is shown as follows: Dec. 31, 20Y3 Dec. 31, 20Y2 Assets Cash $261,120 $243,460...
-
What are the components of a goal concept?
-
Which goals dominate the goal system of public administrations?
-
What is the core of the Theory of Public Tasks?
-
What potential ethical issues do you see here? How might managers address these ethical issues?
-
Give examples of typical and atypical economic agents.
-
Data table Payment of long-term note payable Depreciation expense. Purchase of equipment with cash Purchase of treasury stock.. Gain on sale of land Cost of goods sold Proceeds from issuance of...
-
In Exercises 1558, find each product. (9 - 5x) 2
-
Go to a Web site such as Yahoo.com and find the financial statements of General Motors (GM) and Ford Motor Company (F). Compare these two companies using the following financial ratios: times...
-
What are the bond equivalent yields of the March 30, April 30, and June 30T-Bills? Maturity Mar 30 Apr 30 Jun 30 Aug 30 Days to Maturity 28 59 120 181 Bank Discount 1.20 2.00 2.45
-
The CFO of DMI is trying to determine the companys WACC. Brad, a promising MBA, says that the company should use book value to assign the components percentage for the WACC. Angela, a long-time...
-
Determine and plot the frequency response of the filter shown in Figure 4.41, considering the two possible positions for the switches. x(n) -z-2 -z-2 -z-2 z-4 z-4 Fig. 4.41. Signal flowgraph of a...
-
Determine the impulse response of the filter shown in Figure 4.42. x(n) 0.5 z-1 -0.75 0.5 y(n) Z-1 Fig. 4.42. Signal flowgraph of a digital filter.
-
Show that if two given networks are described by \(Y_{i}=\sum_{j=1}^{M} T_{i j} X_{j}\) and \(Y_{i}^{\prime}=\) \(\sum_{j=1}^{M} T_{i j}^{\prime} X_{j}^{\prime}\), then these networks are...
Data Mining With R Studio Handbook Of Theory And Practice 1st Edition - ISBN: B0BZFRP6S5 - Free Book

Study smarter with the SolutionInn App