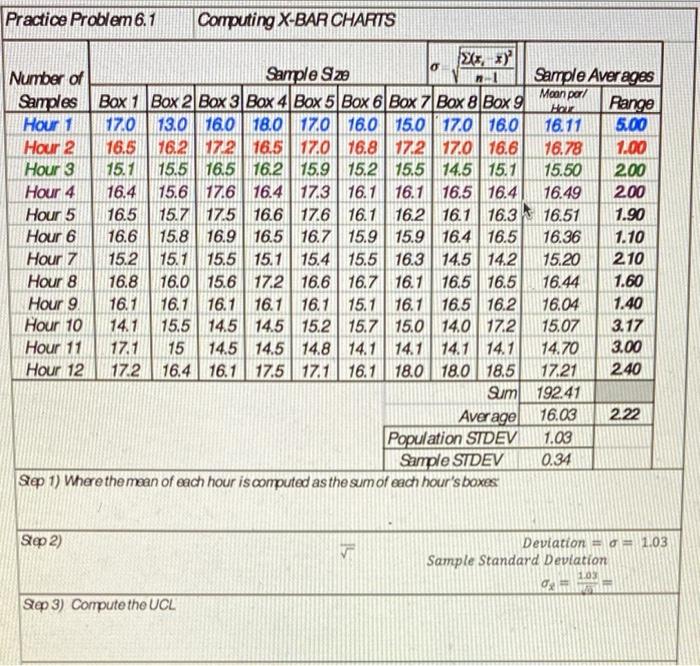
Question: Practice Problem 6.1 Computing X-BAR CHARTS Hour Number of Sample Sze Samples Box 1 Box 2 Box 3 Box 4 Box 5 Box 6 Box

Practice Problem 6.1 Computing X-BAR CHARTS Hour
Practice Problem 6.1 Computing X-BAR CHARTS Hour Number of Sample Sze Samples Box 1 Box 2 Box 3 Box 4 Box 5 Box 6 Box Z Box 8 Box 9 Hour 1 17.0 13.0 16.0 18.0 17.0 16.0 15.0 17.0 16.0 Hour 2 16.5 16.2 17216.5 17.0 16.8 17.2 17.0 16.6 Hour 3 15.1 15.5 16.5 16.2 15.9 15.2 15.5 14.5 15.1 Hour 4 16.4 15.6 17.6 16.4 17.3 16.1 16.1 16.5 16.4 Hour 5 16.5 15.7 17.5 16.6 17.6 16.1 16.2 16.1 16.3 Hour 6 16.6 15.8 16.9 16.5 16.7 15.9 15.9 16.4 16.5 Hour 7 15.2 15.1 15.5 15.1 15.4 15.5 16.3 14.5 14.2 Hour 8 16.8 16.0 15.6 17.2 16.6 16.7 16.1 16.5 16.5 Hour 9 16.1 16.1 16.1 16.1 16.1 15.1 16.1 16.5 16.2 Hour 10 14.1 15.5 14.5 14.5 15.2 15.7 15.0 14.0 17.2 Hour 11 17.1 15 14.5 14.5 14.8 14.114.1 14.114.1 Hour 12 172 16.4 16.1 17.5 171 16.1 18.0 18.0 18.5 Sum Average Population STDEV Sample SIDEV Step 1) Where the mean of each hour is computed as the sum of each hour's boxes Sample Averages Moan por Pange 16.11 5.00 16.78 1.00 15.50 200 16.49 200 16.51 1.90 16.36 1.10 15.20 210 16.44 1.60 16.04 1.40 15.07 3.17 14.70 3.00 17.21 240 192.41 16.03 2.22 1.03 0.34 Step 2) 15 Deviation = 1.03 Sample Standard Deviation 1.03 Step 3) Compute the UCL Consider you handout problem 6.1. In this problem the X Bar Lower Control Limit (LCL) when considering 99.73% of the distribution is known to be: Your

Step by Step Solution

There are 3 Steps involved in it

1 Expert Approved Answer
Step: 1 Unlock blur-text-image
Question Has Been Solved by an Expert!

Get step-by-step solutions from verified subject matter experts

Step: 2 Unlock
Step: 3 Unlock

Students Have Also Explored These Related General Management Questions!