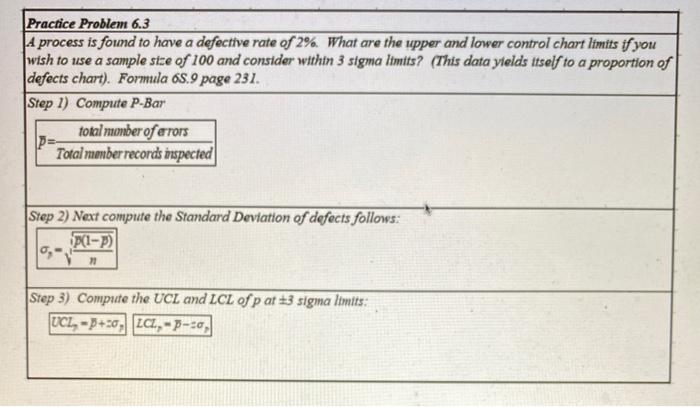
Question: Practice Problem 6.3 4 process is found to have a defective rate of 2%. What are the upper and lower control chart limits if you

Practice Problem 6.3 4 process is found to have a
Practice Problem 6.3 4 process is found to have a defective rate of 2%. What are the upper and lower control chart limits if you wish to use a sample stce of 100 and consider within 3 sigma Imits? (This data yields itself to a proportion of defects chart). Formula 6.9 page 231. Step 1) Compute P-Bar total number of errors P= Total number records respected Step 2) Next compute the Standard Deviation of defects follows: P(1-12 Step 3) Compute the UCL and LCL of p at 1:3 sigma limits: UCI, - +30, LCL-P-0

Step by Step Solution

There are 3 Steps involved in it

1 Expert Approved Answer
Step: 1 Unlock blur-text-image
Question Has Been Solved by an Expert!

Get step-by-step solutions from verified subject matter experts

Step: 2 Unlock
Step: 3 Unlock

Students Have Also Explored These Related General Management Questions!