

Question: Practice Problems 1) A professor has found that student performance on the first midterm predicts performance on the second midterm. The higher a student scored
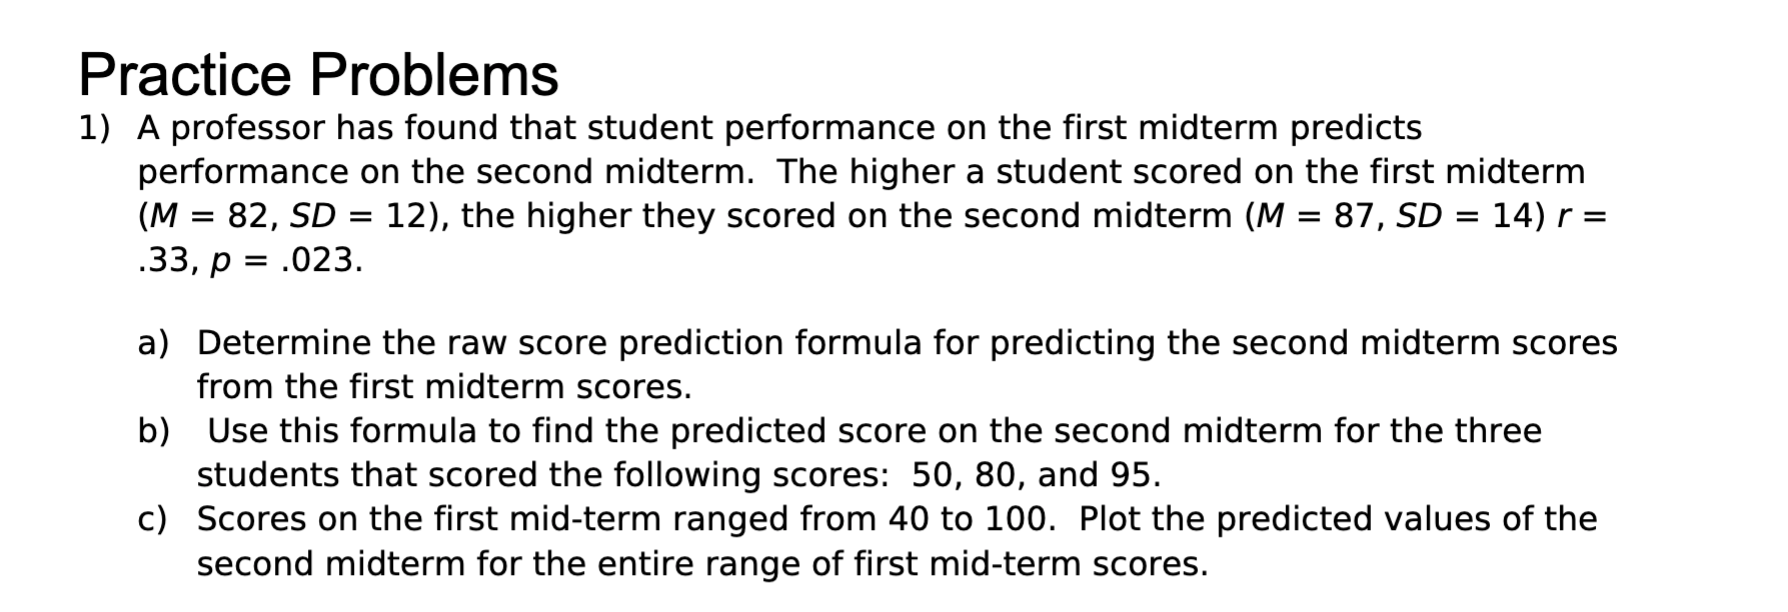

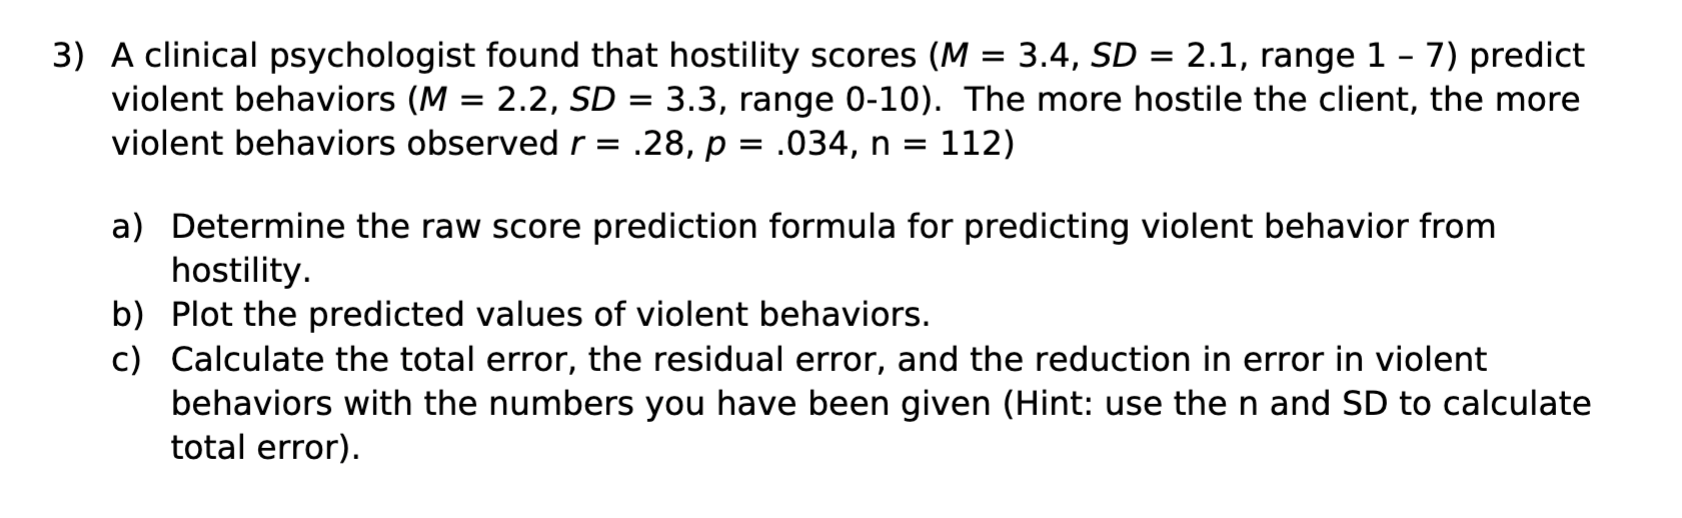

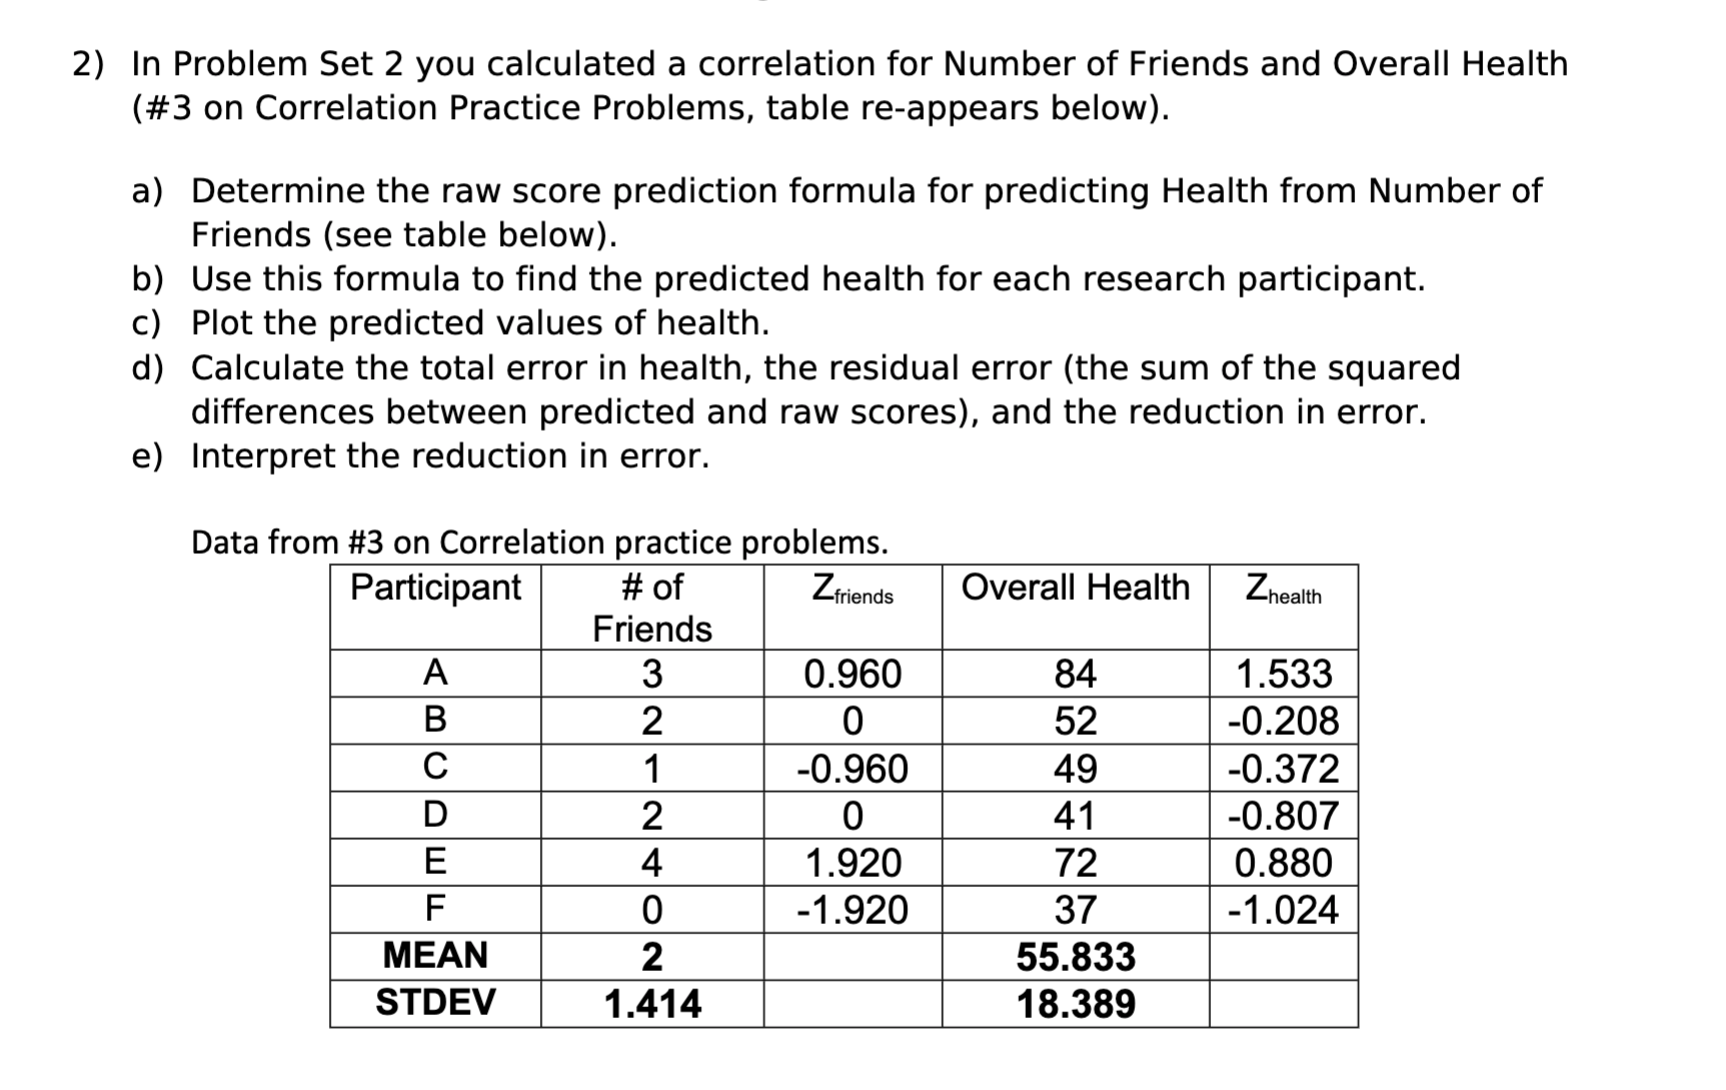

Practice Problems 1) A professor has found that student performance on the first midterm predicts performance on the second midterm. The higher a student scored on the first midterm (M = 82, SD = 12), the higher they scored on the second midterm (M = 87, SD = 14) r = .33, p = .023. a) Determine the raw score prediction formula for predicting the second midterm scores from the first midterm scores. b) Use this formula to find the predicted score on the second midterm for the three students that scored the following scores: 50, 80, and 95. c) Scores on the first mid-term ranged from 40 to 100. Plot the predicted values of the second midterm for the entire range of first mid-term scores. 2) In Problem Set 2 you calculated a correlation for Number of Friends and Overall Health (#3 on Correlation Practice Problems, table re-appears below). a) Determine the raw score prediction formula for predicting Health from Number of Friends (see table below). b) Use this formula to find the predicted health for each research participant. c) Plot the predicted values of health. d) Calculate the total error in health, the residual error (the sum of the squared differences between predicted and raw scores). and the reduction in error. e) Interpret the reduction in error. Data from #3 on Correlation practice problems. Participant #of Zmends Overall Health 2mm. Fends A 3 0.960 84 1 .533 52 -0.208 49 . D 2 0 41 -O.807 E 4 1 .920 72 0.880 F 0 -1.920 37 -1.024 MEAN 2 55.833 STDEV 1.414 18.389 3) A clinical psychologist found that hostility scores (M = 3.4, SD = 2.1, range 1 7) predict violent behaviors (M = 2.2, SD = 3.3, range 0-10). The more hostile the client, the more violent behaviors observed r = .28, p = .034, n = 112) a) Determine the raw score prediction formula for predicting violent behavior from hostility. b) Plot the predicted values of violent behaviors. c) Calculate the total error, the residual error, and the reduction in error in violent behaviors with the numbers you have been given (Hint: use the n and SD to calculate total error)
Step by Step Solution
There are 3 Steps involved in it

Get step-by-step solutions from verified subject matter experts