

Question: Practice Problems for Chapter 4 Ratio Analysis Devon Energy Inc. (DEV) is a power generator and distributor, which participates heavily in regulated and unregulated (spot)
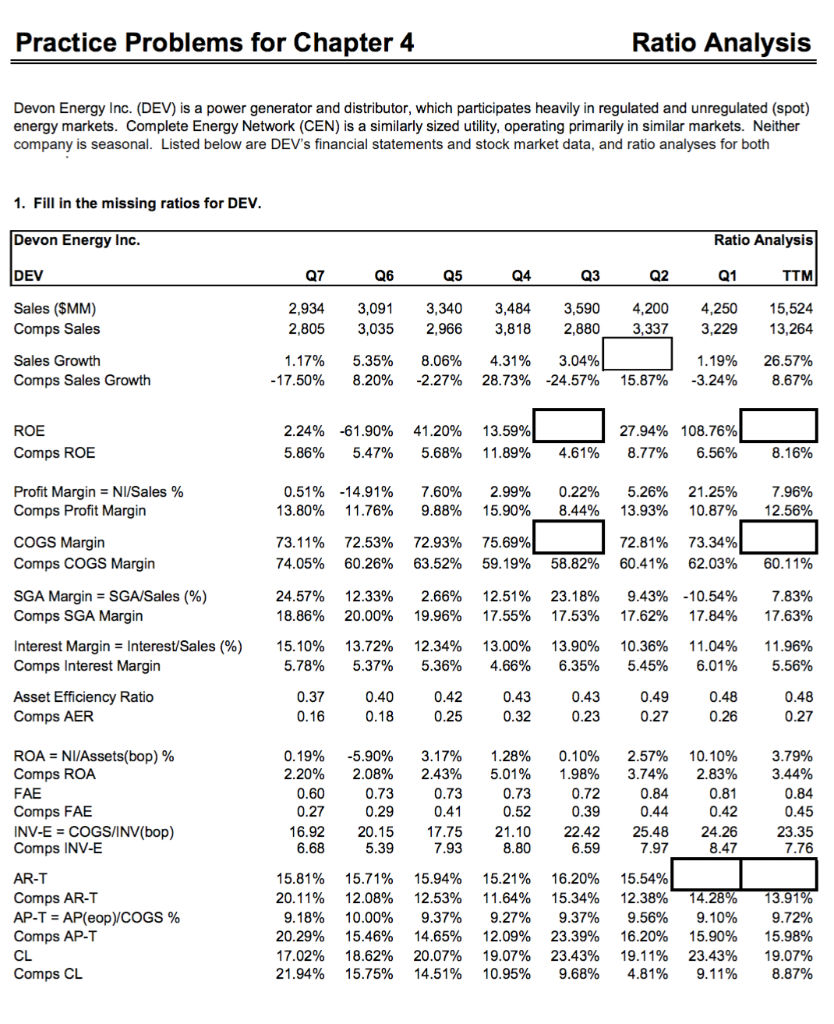
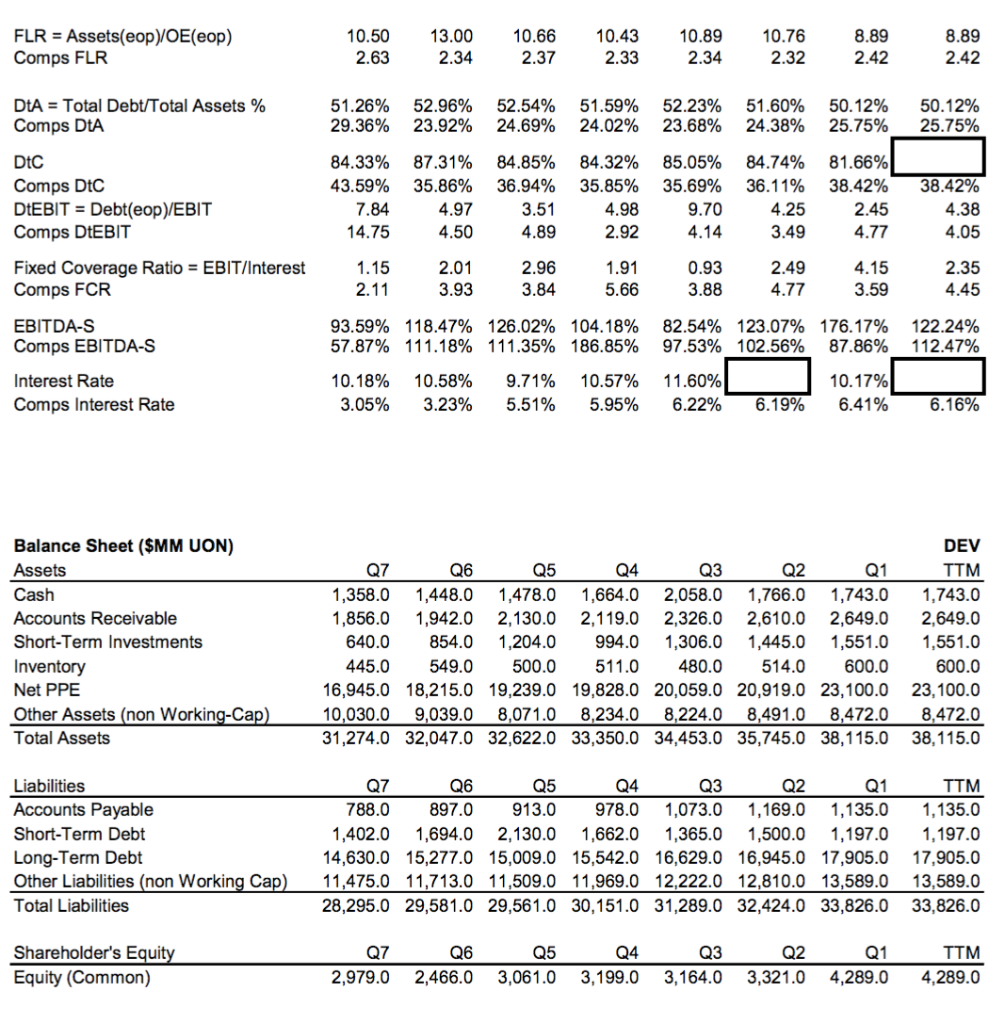
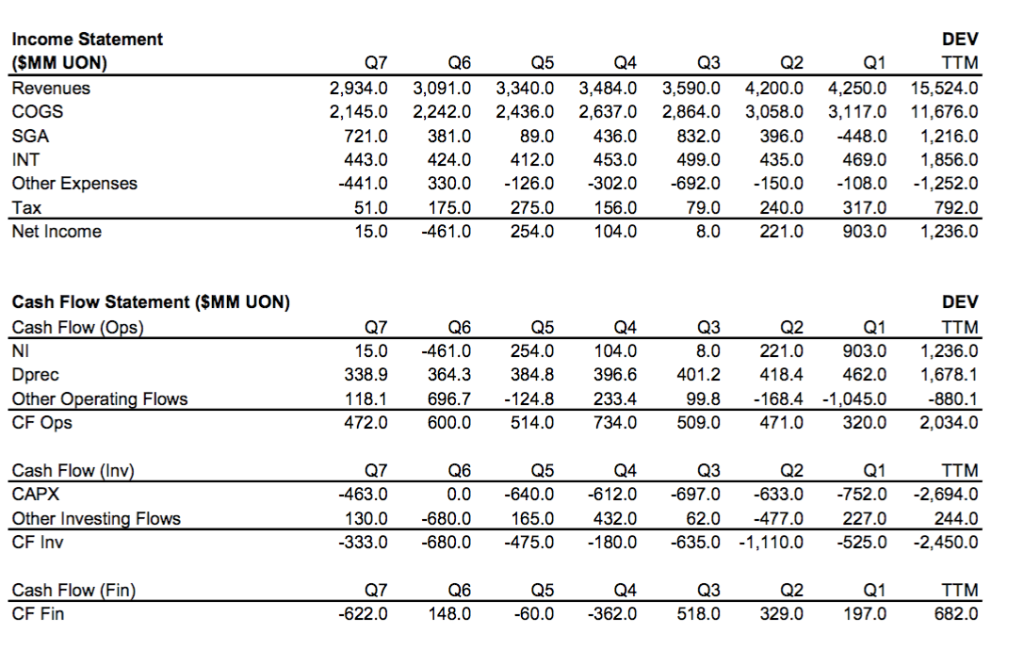
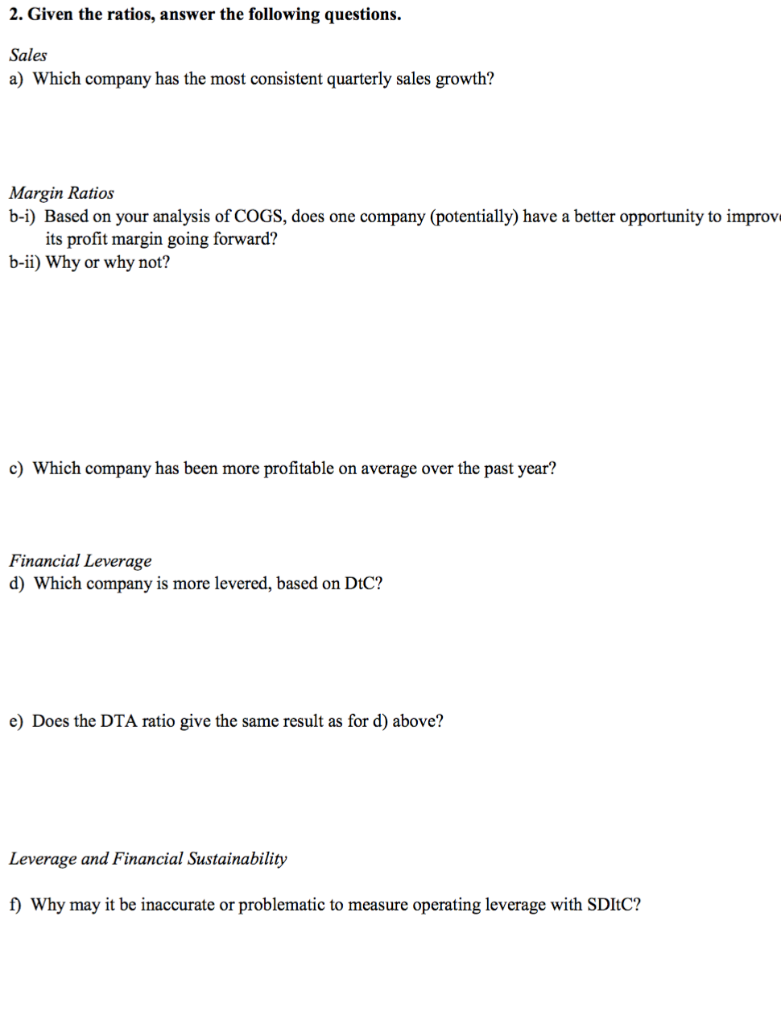
Practice Problems for Chapter 4 Ratio Analysis Devon Energy Inc. (DEV) is a power generator and distributor, which participates heavily in regulated and unregulated (spot) energy markets. Complete Energy Network (CEN) is a similarly sized utility, operating primarily in similar markets. Neither company is seasonal. Listed below are DEV's financial statements and stock market data, and ratio analyses for both 1. Fill in the missing ratios for DEV Devon Energy Inc. DEV Sales (SMM) Comps Sales Sales Growth Comps Sales Growth Ratio Analysis TTM 2,9343,091 3,340 3,484 3,590 4,200 4,250 15,524 2,8053,035 2,966 3,818 2,880 3,337 3,229 13,264 1.19% 26.57% -17.50% 8.20% -2.27% 28.73%-24.57% 15.87% -3.24% 8.67% Q7 Q4 Q2 1.17% 5.35% 8.06% 4.31% 3.04% ROE Comps ROE 2.24% 5.86% -61.90% 5.47% -14.91% 11.76% 72.53% 60.26% 12.33% 20.00% 13.72% 5.37% 0.40 41.20% 5.68% 7.60% 9.88% 72.93% 63.52% 2.66% 19.96% 12.34% 5.36% 0.42 0.25 3.17% 2.43% 13.59% 11.89% 2.99% 15.90% 75.69% 59.19% 12.51% 17.55% 13.00% 4.66% 0.43 27.94% 8.77% 108.76% 6.56% 4.61% 8.16% Profit Margin NI/Sales % Comps Profit Margin 0.51% 13.80% 0.22% 8.44% 5.26% 13.93% 21.25% 10.87% 7.96% 12.56% COGS Margin Comps COGS Margin 73.11% 74.05% 72.81% 60.41% 73.34% 62.03% 58.82% 60.11% SGA Margin-SGA/Sales (%) Comps SGA Margin 24.57% 18.86% 23.18% 17.53% 9.43% 17.62% -10.54% 17.84% 7.83% 17.63% Interest Margin = Interest/Sales (%) Comps Interest Margin 15.10% 5.78% 13.90% 6.35% 10.36% 5.45% 11.04% 6.01% 11.96% 5.56% Asset Efficiency Ratio Comps AER 0.37 0.16 0.43 0.23 0.49 0.27 0.48 0.26 0.48 0.27 ROA-NI/Assets(bop) % Comps ROA FAE Comps FABE INV-E COGS/INV(bop) Comps INV-E AR-T Comps AR-T AP-T = AP(eop)/COGS % Comps AP-T CL Comps CL 0.19% 2.20% 0.60 0.27 10.10% 2.83% 0.81 0.42 16.92 20.15 17.75 21.10 22.42 25.48 24.26 -5.90% 2.08% 0.73 0.29 1.28% 5.01% 0.10% 1.98% 2.57% 3.74% 0.84 0.44 3.79% 3.44% 0.84 0.45 23.35 7.76 0.39 6.59 16.20% 6.68 7.93 8.80 7.97 15.81% 15.71% 15.94% 15.21% 15.54% 20.11% 12.08% 12.53% 11.64% 15.34% 12.38% 14 9.18% 20.29% 17.02% 21.94% 10.00% 15.46% 18.62% 15.75% 9.37% 14.65% 20.07% 14.51% 9.27% 12.09% 19.07% 10.95% 9.37% 23.39% 23.43% 9.68% 9.56% 16.20% 19.11% 4.81% 9.10% 15.90% 23.43% 9.11% 9.72% 15.98% 19.07% 8.87% Income Statement (SMM UON) Revenues COGS SGA INT Other Expenses Tax Net Income DEV TTM 2,934.0 3,091.0 3,340.0 3,484.0 3,590.0 4,200.0 4,250.0 15,524.0 2,145.0 2,242.0 2,436.0 2,637.0 2,864.0 3,058.0 3,117.0 11,676.0 89.0436.0 832.0 396.0 448.0 1,216.0 443.0 424.0 412.0 453.0 499.0 435.0469.0 1,856.0 -441.0 330.0 126.0 302.0-692.0150.0 108.0 -1,252.0 792.0 8.0 221.0 903.0 1,236.0 Q7 Q6 Q5 Q4 Q3 Q2 Q1 721.0 381.0 51.0175.0 275.0 156.0 15.0-461.0 254.0104.0 79.0 240.0 317.0 Cash Flow Statement (SMM UON) Cash Flow (Ops NI Dprec Other Operating Flows CF Ops DEV TTM 8.0 221.0903.0 1,236.0 338.9 364.3 384.8 396.6 401.2 418.4462.0 1,678.1 -880.1 472.0600.0 514.0 734.0509.0471.0 320.0 2,034.0 Q4 15.0-461.0 254.0 104.0 Q7 Q6 Q5 Q3 Q2 Q1 118.1 696.7-124.8 233.4 99.8-168.4 -1,045.0 Q7 -463.0 Q6 0.0 Q5 Q4 Q3 Q1 Cash Flow (Inv CAPX Other Investing Flows CF Inv TTM 640.0 -612.0 -697.O -633.0 -752.0 -2,694.0 244.0 333.0 -680.0 475.0 180.0-635.0 1,110.0 525.0 2,450.0 Q2 130.0 -680.0 165.0 432.0 62.0 -477.0227.0 Q6 148.0 Cash Flow (Fin Q7 -622.0 Q1 -60.0 -362.0 518.0 329.0197.0 Q5 Q4 Q3 Q2 TTM 682.0 CF Fin 2. Given the ratios, answer the following questions. Sales a) Which company has the most consistent quarterly sales growth? Margin Ratios b-i) Based on your analysis of COGS, does one company (potentially) have a better opportunity to improv its profit margin going forward? b-ii) Why or why not? c) Which company has been more profitable on average over the past year? Financial Leverage d) Which company is more levered, based on DtC? e) Does the DTA ratio give the same result as for d) above? Leverage and Financial Sustainability f) Why may it be inaccurate or problematic to measure operating leverage with SDltC? g-i) Based on TTM EBITDA-S, are both companies operating sustainably? g-ii) Why or why not? h) Use a financial leverage ratio to explain why DEV's interest rate is generally higher than CEN's. Practice Problems for Chapter 4 Ratio Analysis Devon Energy Inc. (DEV) is a power generator and distributor, which participates heavily in regulated and unregulated (spot) energy markets. Complete Energy Network (CEN) is a similarly sized utility, operating primarily in similar markets. Neither company is seasonal. Listed below are DEV's financial statements and stock market data, and ratio analyses for both 1. Fill in the missing ratios for DEV Devon Energy Inc. DEV Sales (SMM) Comps Sales Sales Growth Comps Sales Growth Ratio Analysis TTM 2,9343,091 3,340 3,484 3,590 4,200 4,250 15,524 2,8053,035 2,966 3,818 2,880 3,337 3,229 13,264 1.19% 26.57% -17.50% 8.20% -2.27% 28.73%-24.57% 15.87% -3.24% 8.67% Q7 Q4 Q2 1.17% 5.35% 8.06% 4.31% 3.04% ROE Comps ROE 2.24% 5.86% -61.90% 5.47% -14.91% 11.76% 72.53% 60.26% 12.33% 20.00% 13.72% 5.37% 0.40 41.20% 5.68% 7.60% 9.88% 72.93% 63.52% 2.66% 19.96% 12.34% 5.36% 0.42 0.25 3.17% 2.43% 13.59% 11.89% 2.99% 15.90% 75.69% 59.19% 12.51% 17.55% 13.00% 4.66% 0.43 27.94% 8.77% 108.76% 6.56% 4.61% 8.16% Profit Margin NI/Sales % Comps Profit Margin 0.51% 13.80% 0.22% 8.44% 5.26% 13.93% 21.25% 10.87% 7.96% 12.56% COGS Margin Comps COGS Margin 73.11% 74.05% 72.81% 60.41% 73.34% 62.03% 58.82% 60.11% SGA Margin-SGA/Sales (%) Comps SGA Margin 24.57% 18.86% 23.18% 17.53% 9.43% 17.62% -10.54% 17.84% 7.83% 17.63% Interest Margin = Interest/Sales (%) Comps Interest Margin 15.10% 5.78% 13.90% 6.35% 10.36% 5.45% 11.04% 6.01% 11.96% 5.56% Asset Efficiency Ratio Comps AER 0.37 0.16 0.43 0.23 0.49 0.27 0.48 0.26 0.48 0.27 ROA-NI/Assets(bop) % Comps ROA FAE Comps FABE INV-E COGS/INV(bop) Comps INV-E AR-T Comps AR-T AP-T = AP(eop)/COGS % Comps AP-T CL Comps CL 0.19% 2.20% 0.60 0.27 10.10% 2.83% 0.81 0.42 16.92 20.15 17.75 21.10 22.42 25.48 24.26 -5.90% 2.08% 0.73 0.29 1.28% 5.01% 0.10% 1.98% 2.57% 3.74% 0.84 0.44 3.79% 3.44% 0.84 0.45 23.35 7.76 0.39 6.59 16.20% 6.68 7.93 8.80 7.97 15.81% 15.71% 15.94% 15.21% 15.54% 20.11% 12.08% 12.53% 11.64% 15.34% 12.38% 14 9.18% 20.29% 17.02% 21.94% 10.00% 15.46% 18.62% 15.75% 9.37% 14.65% 20.07% 14.51% 9.27% 12.09% 19.07% 10.95% 9.37% 23.39% 23.43% 9.68% 9.56% 16.20% 19.11% 4.81% 9.10% 15.90% 23.43% 9.11% 9.72% 15.98% 19.07% 8.87% Income Statement (SMM UON) Revenues COGS SGA INT Other Expenses Tax Net Income DEV TTM 2,934.0 3,091.0 3,340.0 3,484.0 3,590.0 4,200.0 4,250.0 15,524.0 2,145.0 2,242.0 2,436.0 2,637.0 2,864.0 3,058.0 3,117.0 11,676.0 89.0436.0 832.0 396.0 448.0 1,216.0 443.0 424.0 412.0 453.0 499.0 435.0469.0 1,856.0 -441.0 330.0 126.0 302.0-692.0150.0 108.0 -1,252.0 792.0 8.0 221.0 903.0 1,236.0 Q7 Q6 Q5 Q4 Q3 Q2 Q1 721.0 381.0 51.0175.0 275.0 156.0 15.0-461.0 254.0104.0 79.0 240.0 317.0 Cash Flow Statement (SMM UON) Cash Flow (Ops NI Dprec Other Operating Flows CF Ops DEV TTM 8.0 221.0903.0 1,236.0 338.9 364.3 384.8 396.6 401.2 418.4462.0 1,678.1 -880.1 472.0600.0 514.0 734.0509.0471.0 320.0 2,034.0 Q4 15.0-461.0 254.0 104.0 Q7 Q6 Q5 Q3 Q2 Q1 118.1 696.7-124.8 233.4 99.8-168.4 -1,045.0 Q7 -463.0 Q6 0.0 Q5 Q4 Q3 Q1 Cash Flow (Inv CAPX Other Investing Flows CF Inv TTM 640.0 -612.0 -697.O -633.0 -752.0 -2,694.0 244.0 333.0 -680.0 475.0 180.0-635.0 1,110.0 525.0 2,450.0 Q2 130.0 -680.0 165.0 432.0 62.0 -477.0227.0 Q6 148.0 Cash Flow (Fin Q7 -622.0 Q1 -60.0 -362.0 518.0 329.0197.0 Q5 Q4 Q3 Q2 TTM 682.0 CF Fin 2. Given the ratios, answer the following questions. Sales a) Which company has the most consistent quarterly sales growth? Margin Ratios b-i) Based on your analysis of COGS, does one company (potentially) have a better opportunity to improv its profit margin going forward? b-ii) Why or why not? c) Which company has been more profitable on average over the past year? Financial Leverage d) Which company is more levered, based on DtC? e) Does the DTA ratio give the same result as for d) above? Leverage and Financial Sustainability f) Why may it be inaccurate or problematic to measure operating leverage with SDltC? g-i) Based on TTM EBITDA-S, are both companies operating sustainably? g-ii) Why or why not? h) Use a financial leverage ratio to explain why DEV's interest rate is generally higher than CEN's
Step by Step Solution
There are 3 Steps involved in it

Get step-by-step solutions from verified subject matter experts