

Question: Practice Problems - Set 1 PROBLEM 1 : The figure below shows a uniform beam subjected to a distributed load w applied to half of
Practice Problems Set
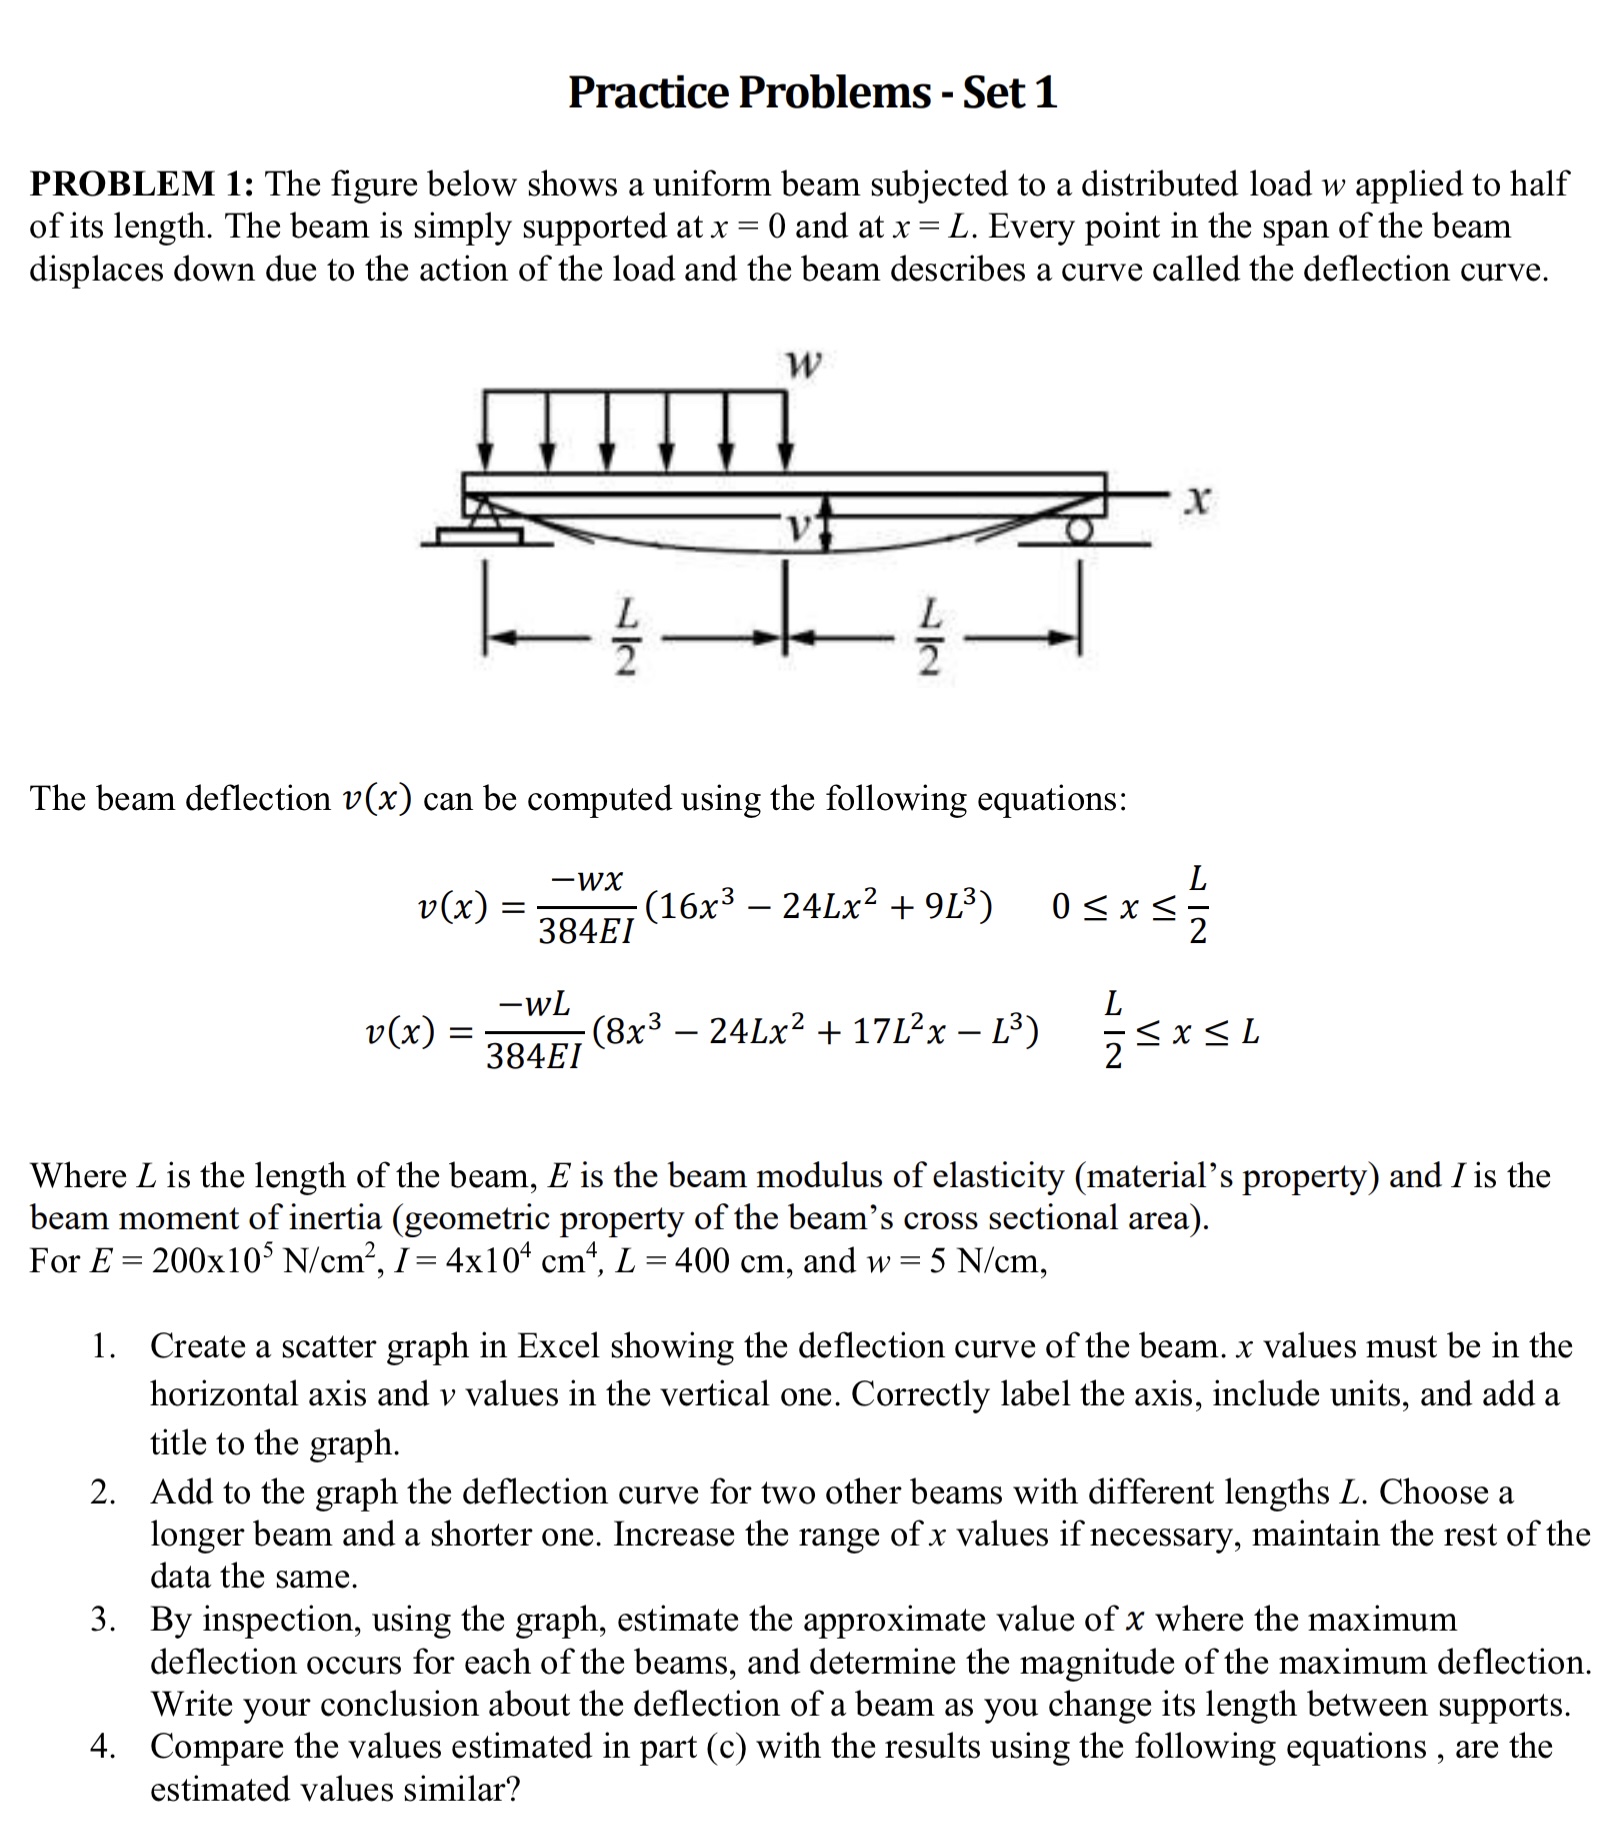
PROBLEM : The figure below shows a uniform beam subjected to a distributed load applied to half
of its length. The beam is simply supported at and at Every point in the span of the beam
displaces down due to the action of the load and the beam describes a curve called the deflection curve.
The beam deflection can be computed using the following equations:
Where is the length of the beam, is the beam modulus of elasticity materials property and I is the
beam moment of inertia geometric property of the beam's cross sectional area
For and
Create a scatter graph in Excel showing the deflection curve of the beam. values must be in the
horizontal axis and values in the vertical one. Correctly label the axis, include units, and add a
title to the graph.
Add to the graph the deflection curve for two other beams with different lengths Choose a
longer beam and a shorter one. Increase the range of values if necessary, maintain the rest of the
data the same.
By inspection, using the graph, estimate the approximate value of where the maximum
deflection occurs for each of the beams, and determine the magnitude of the maximum deflection.
Write your conclusion about the deflection of a beam as you change its length between supports.
Compare the values estimated in part c with the results using the following equations, are the
estimated values similar?
Please do it in Excel, please!!! Thank you!!!
Step by Step Solution
There are 3 Steps involved in it
1 Expert Approved Answer
Step: 1 Unlock

Question Has Been Solved by an Expert!
Get step-by-step solutions from verified subject matter experts
Step: 2 Unlock
Step: 3 Unlock