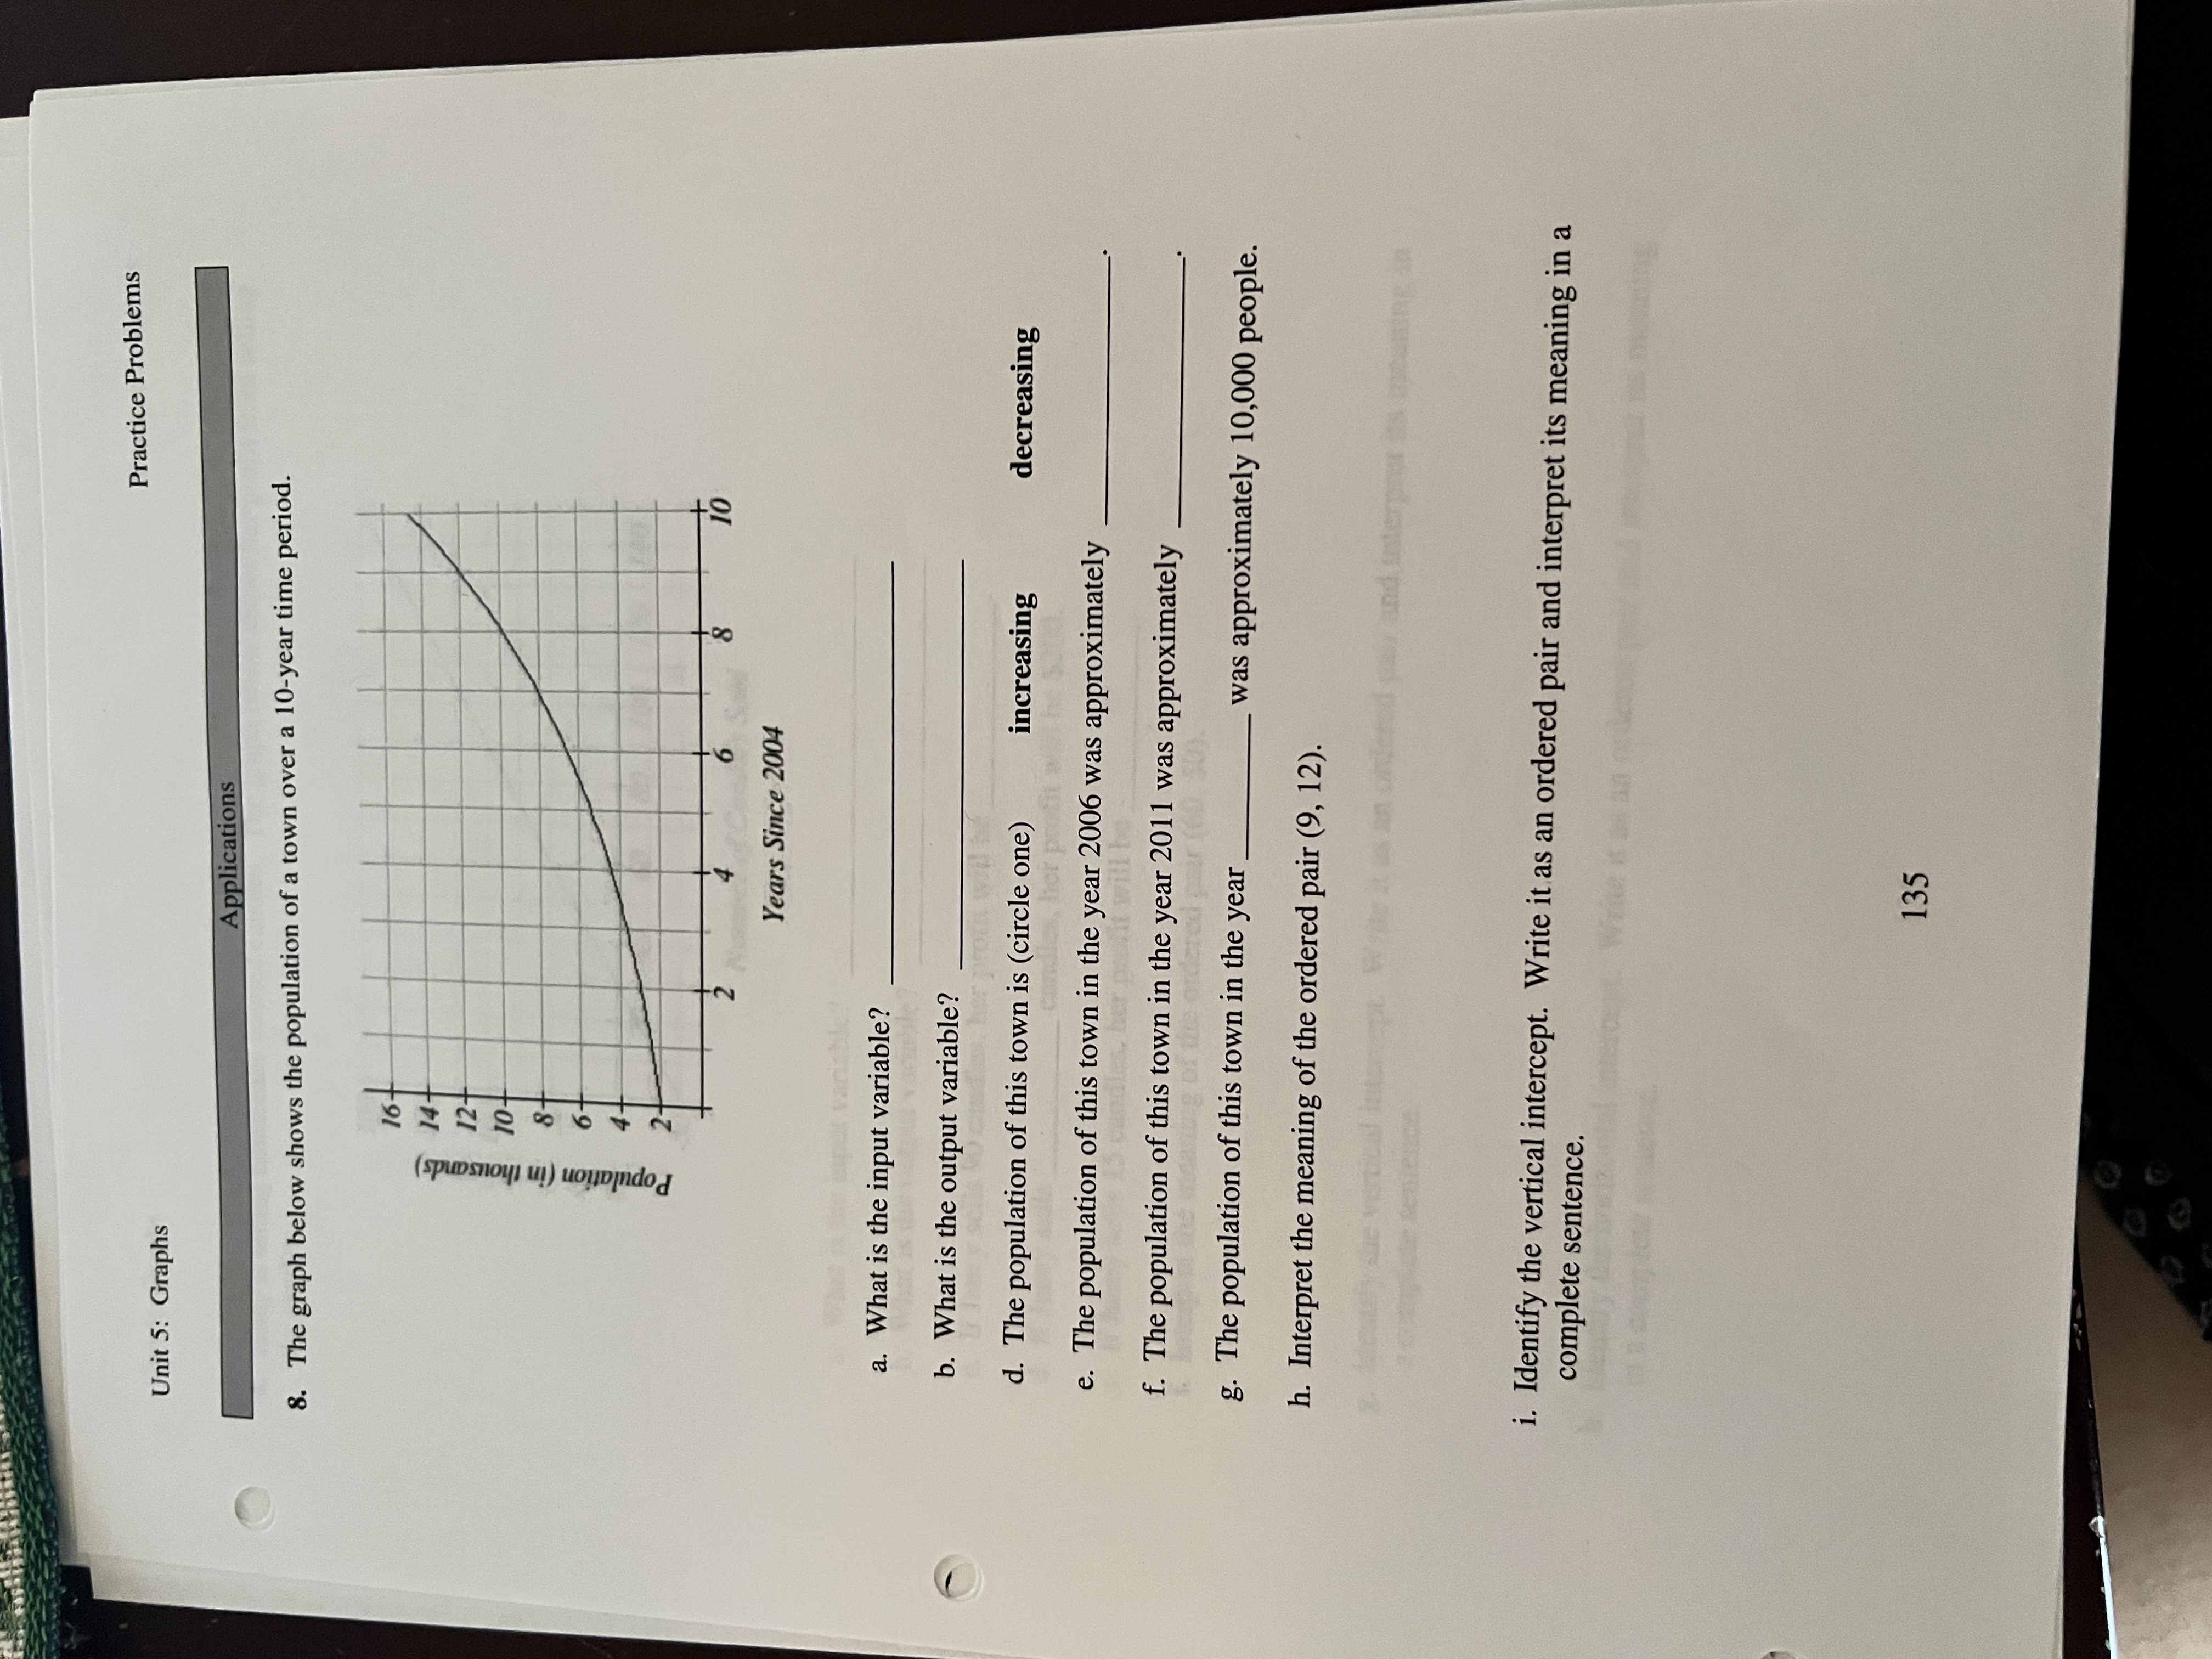
Question: Practice Problems Unit 5: Graphs Applications 8. The graph below shows the population of a town over a 10-year time period. 16 Population (in thousands)
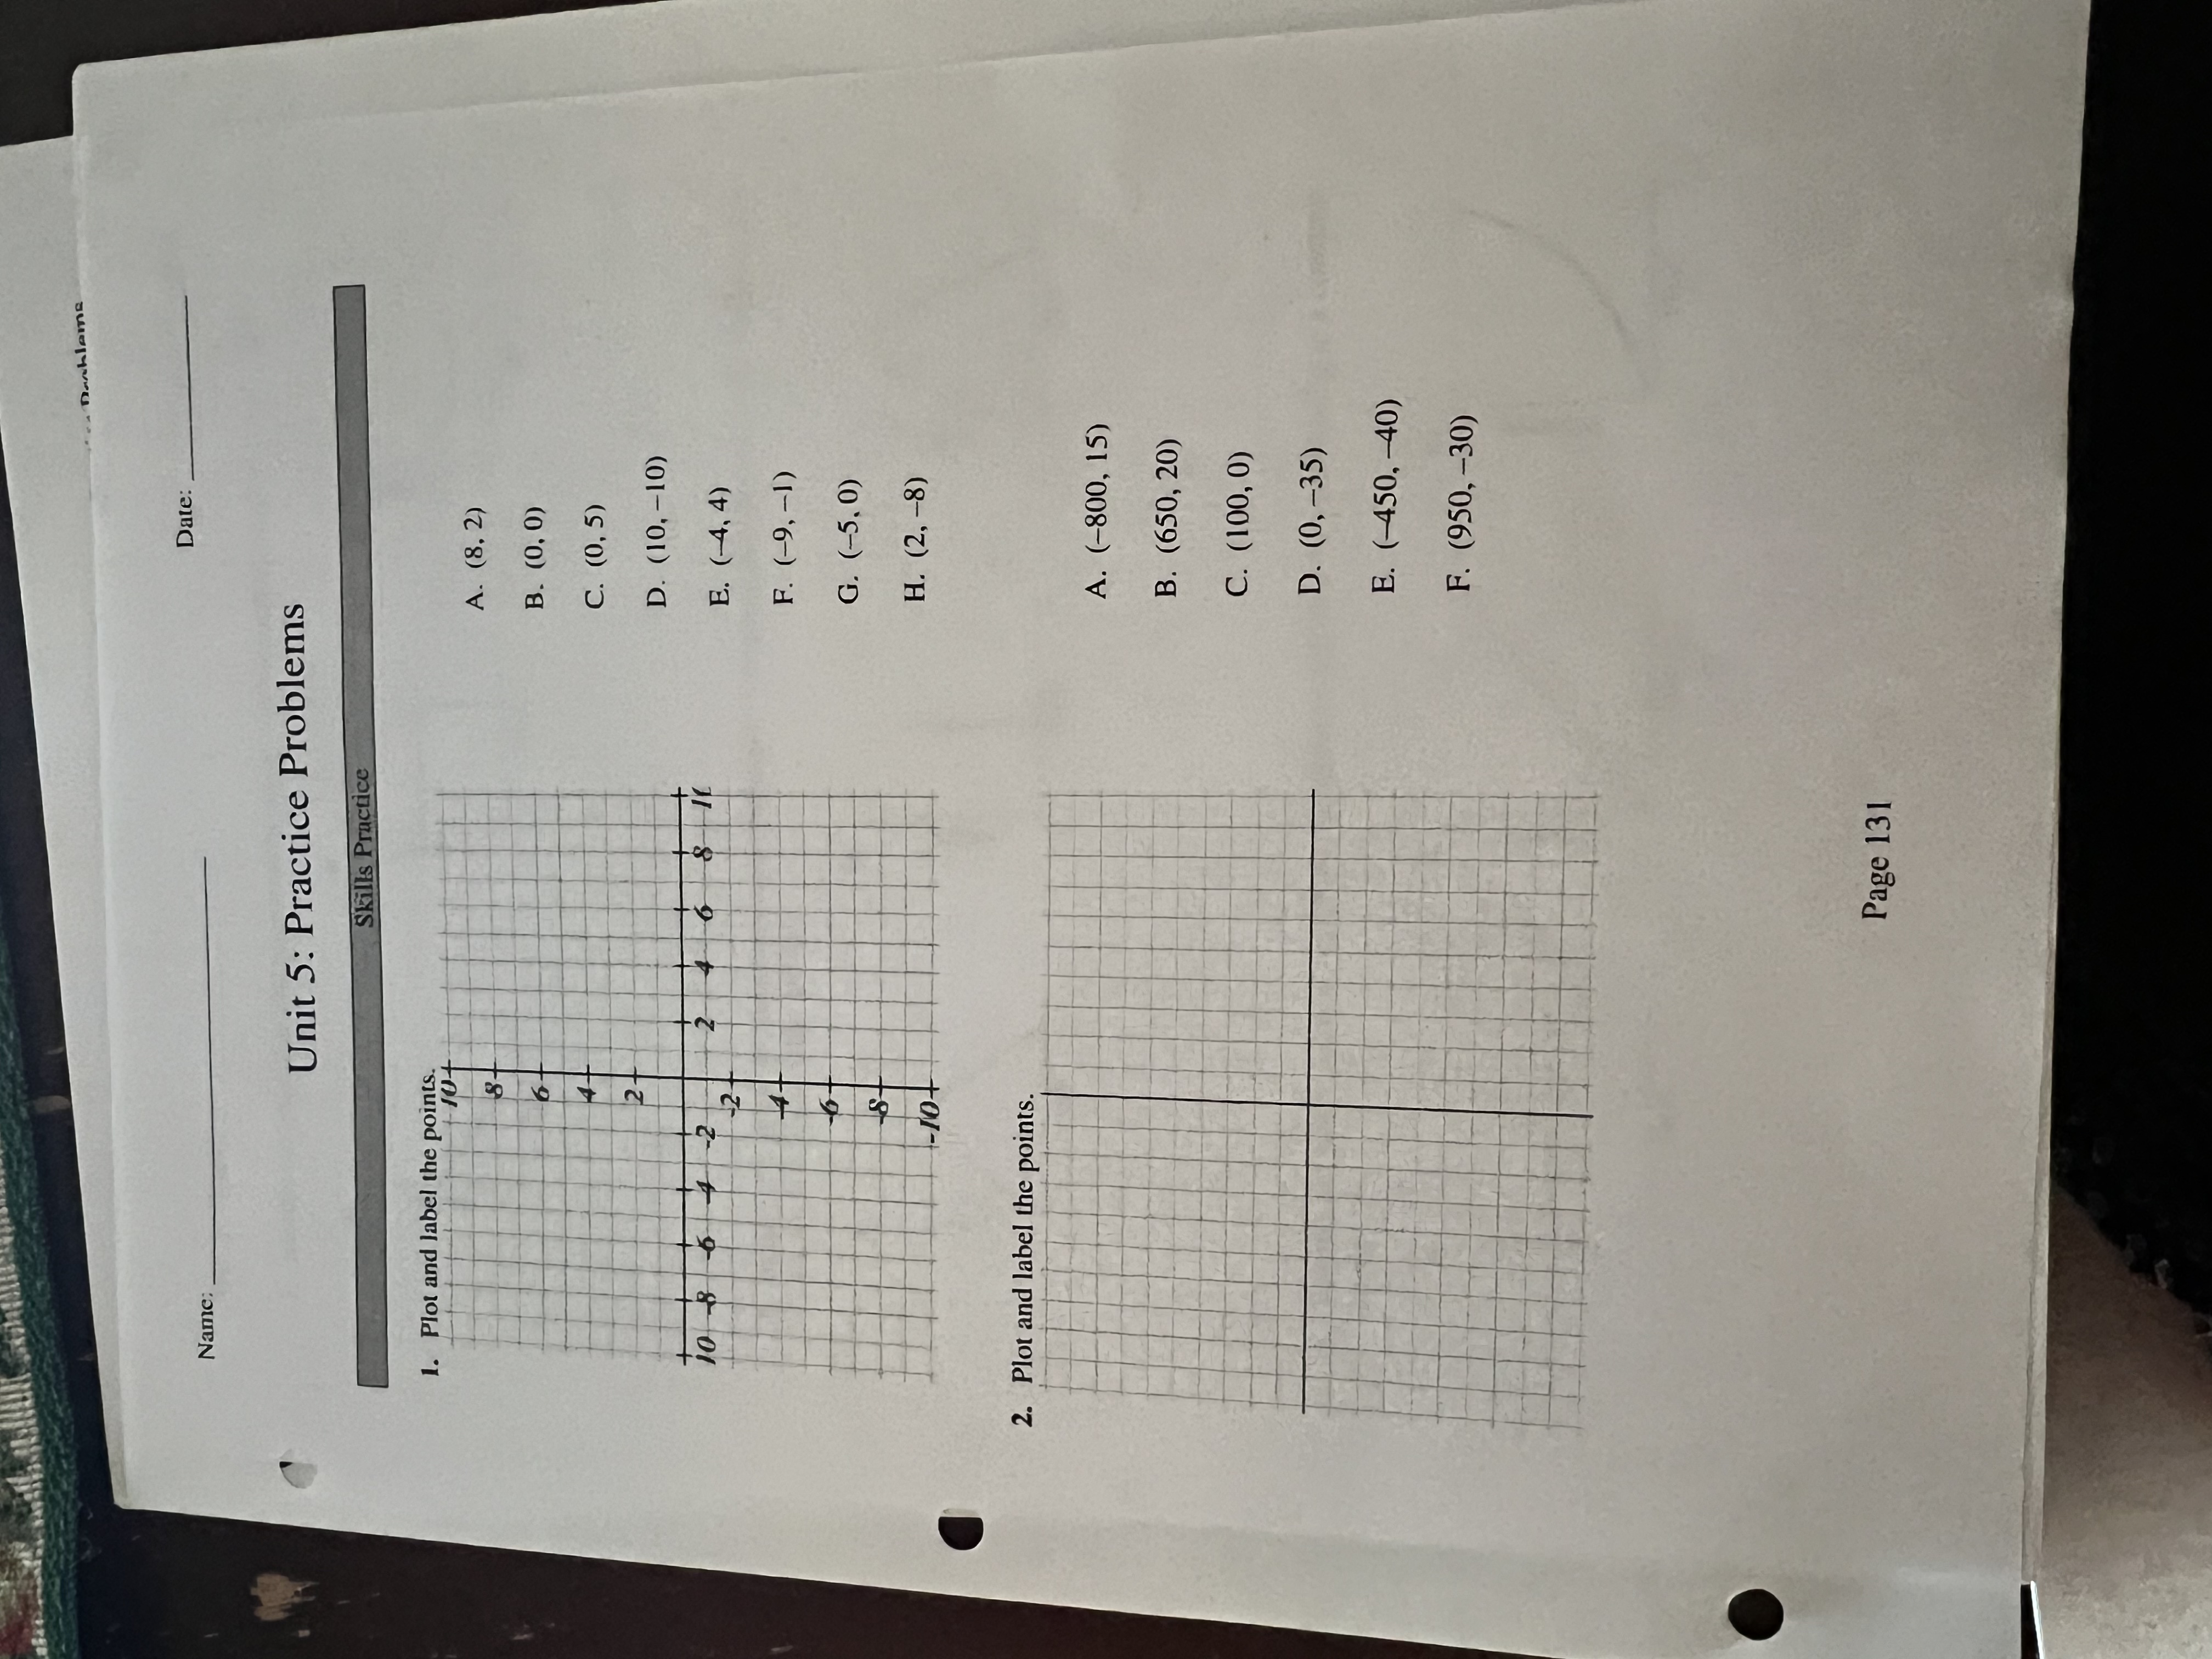
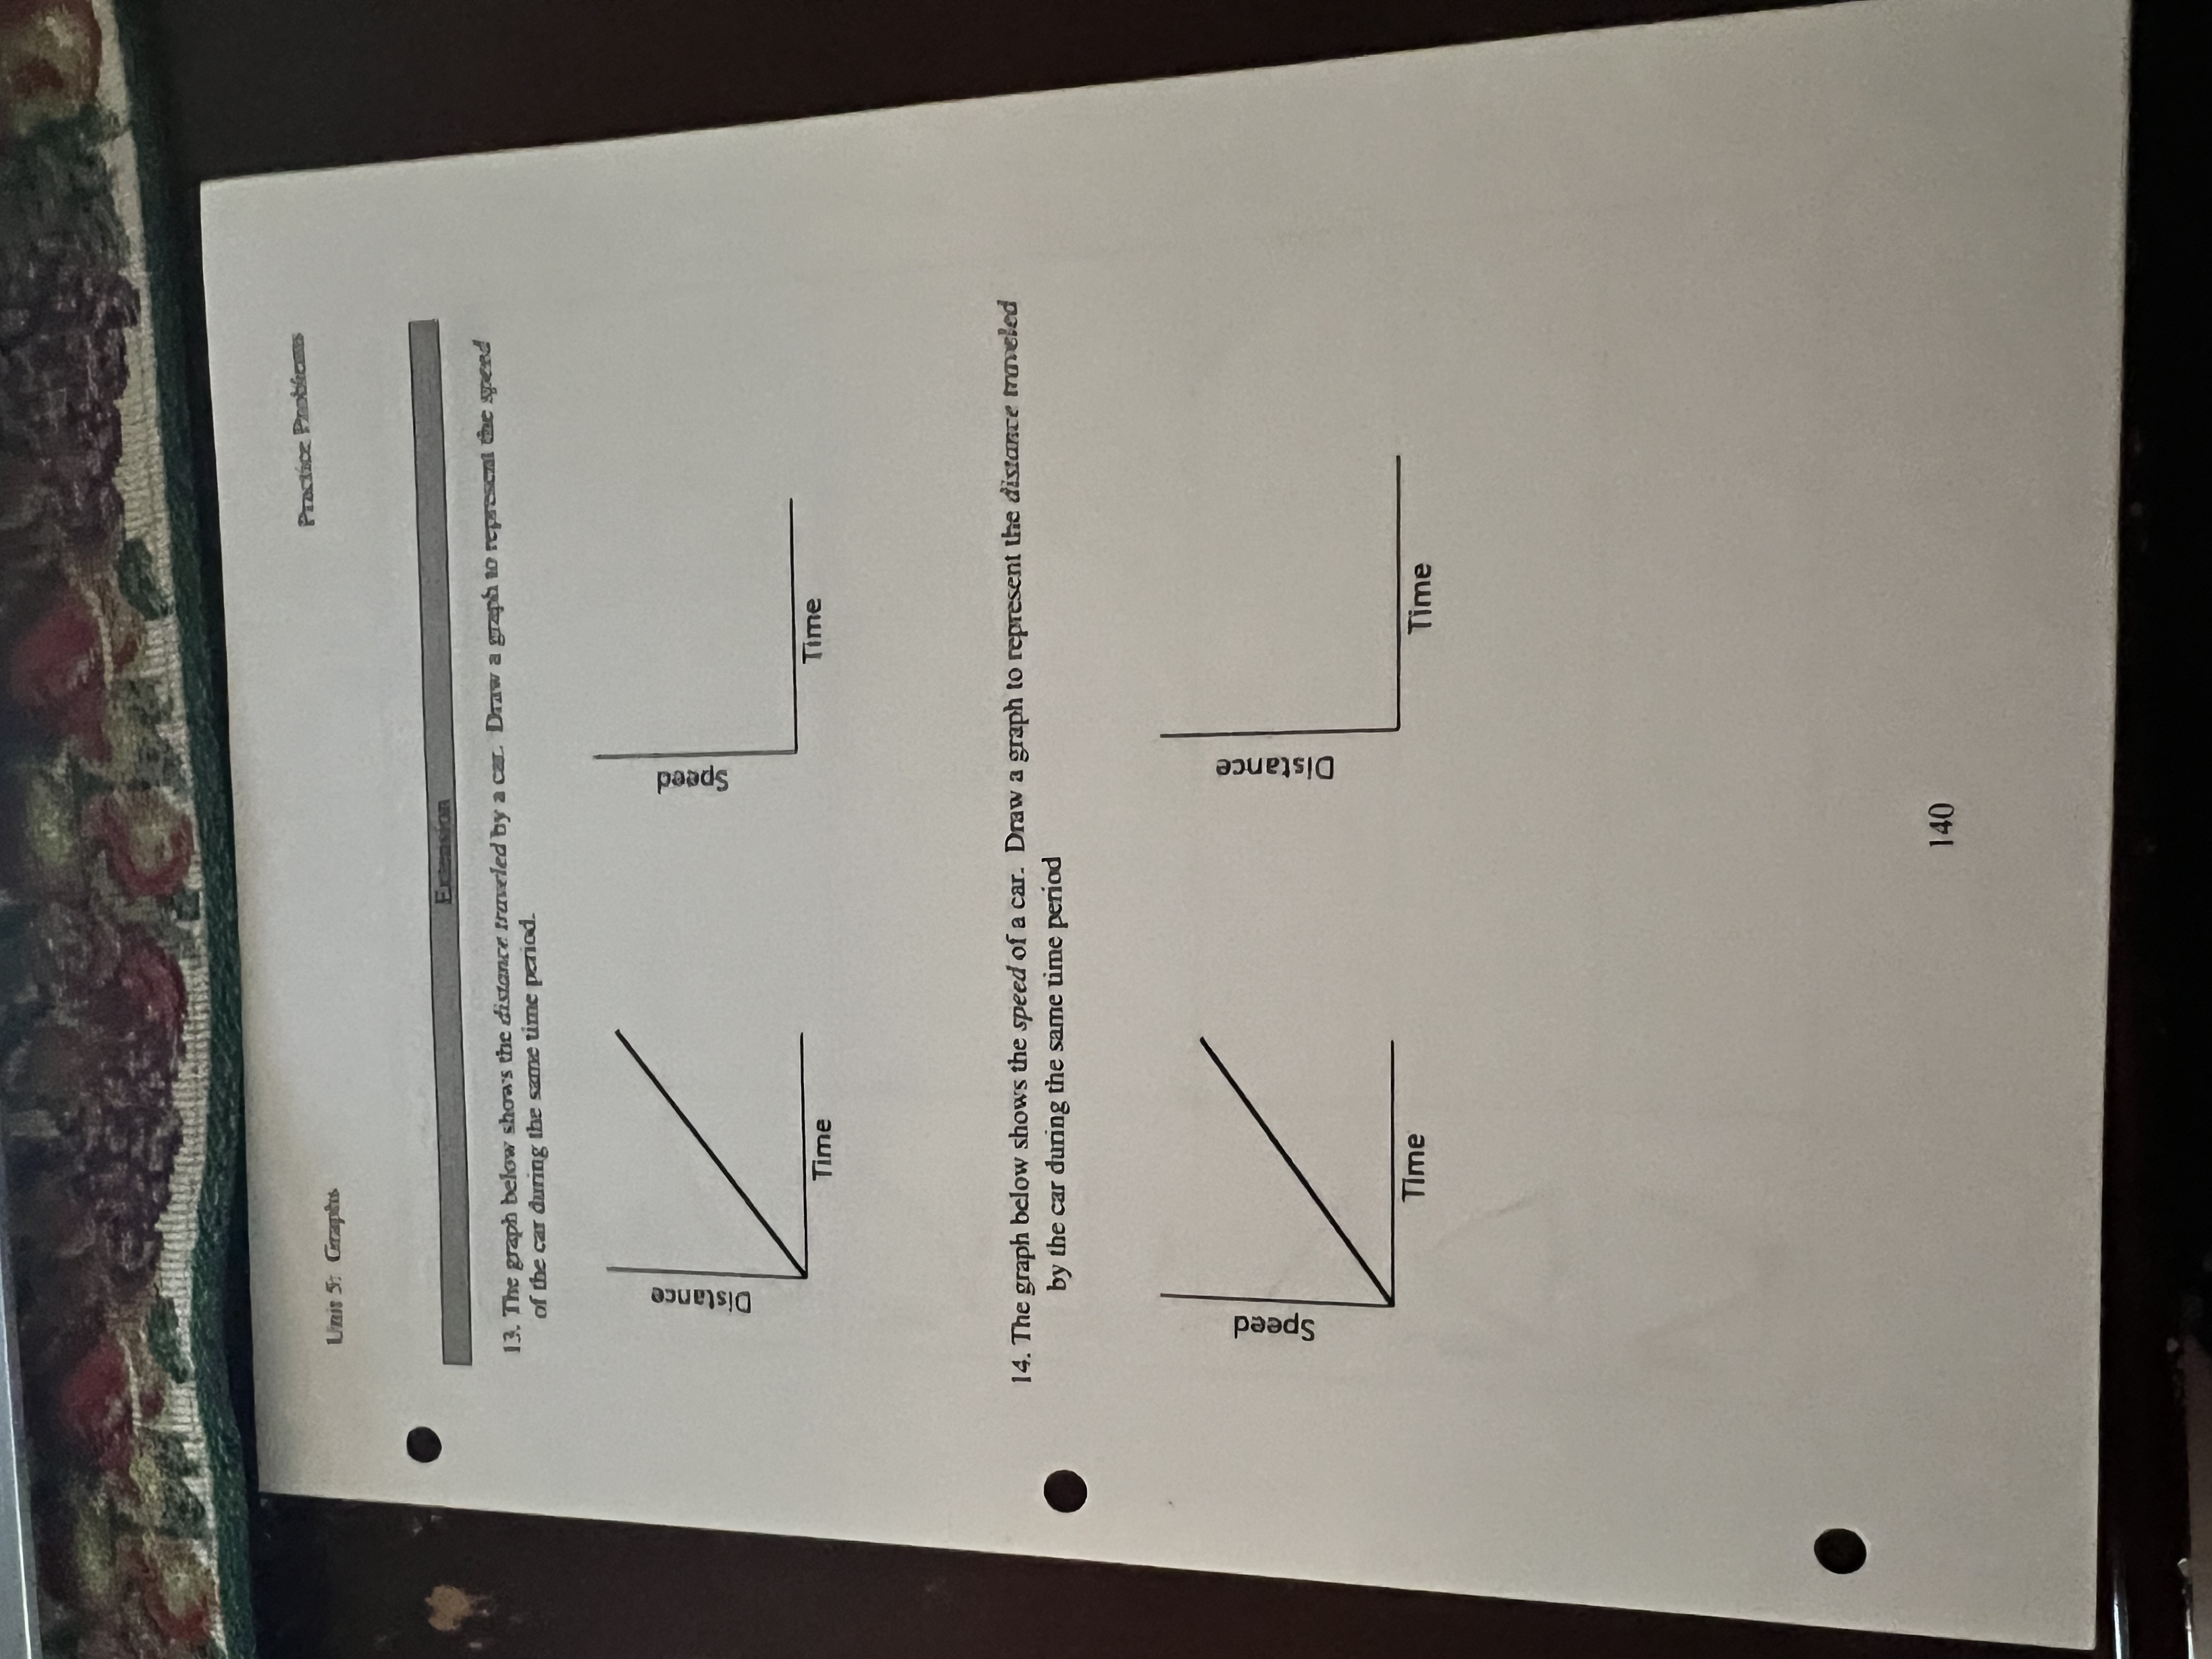
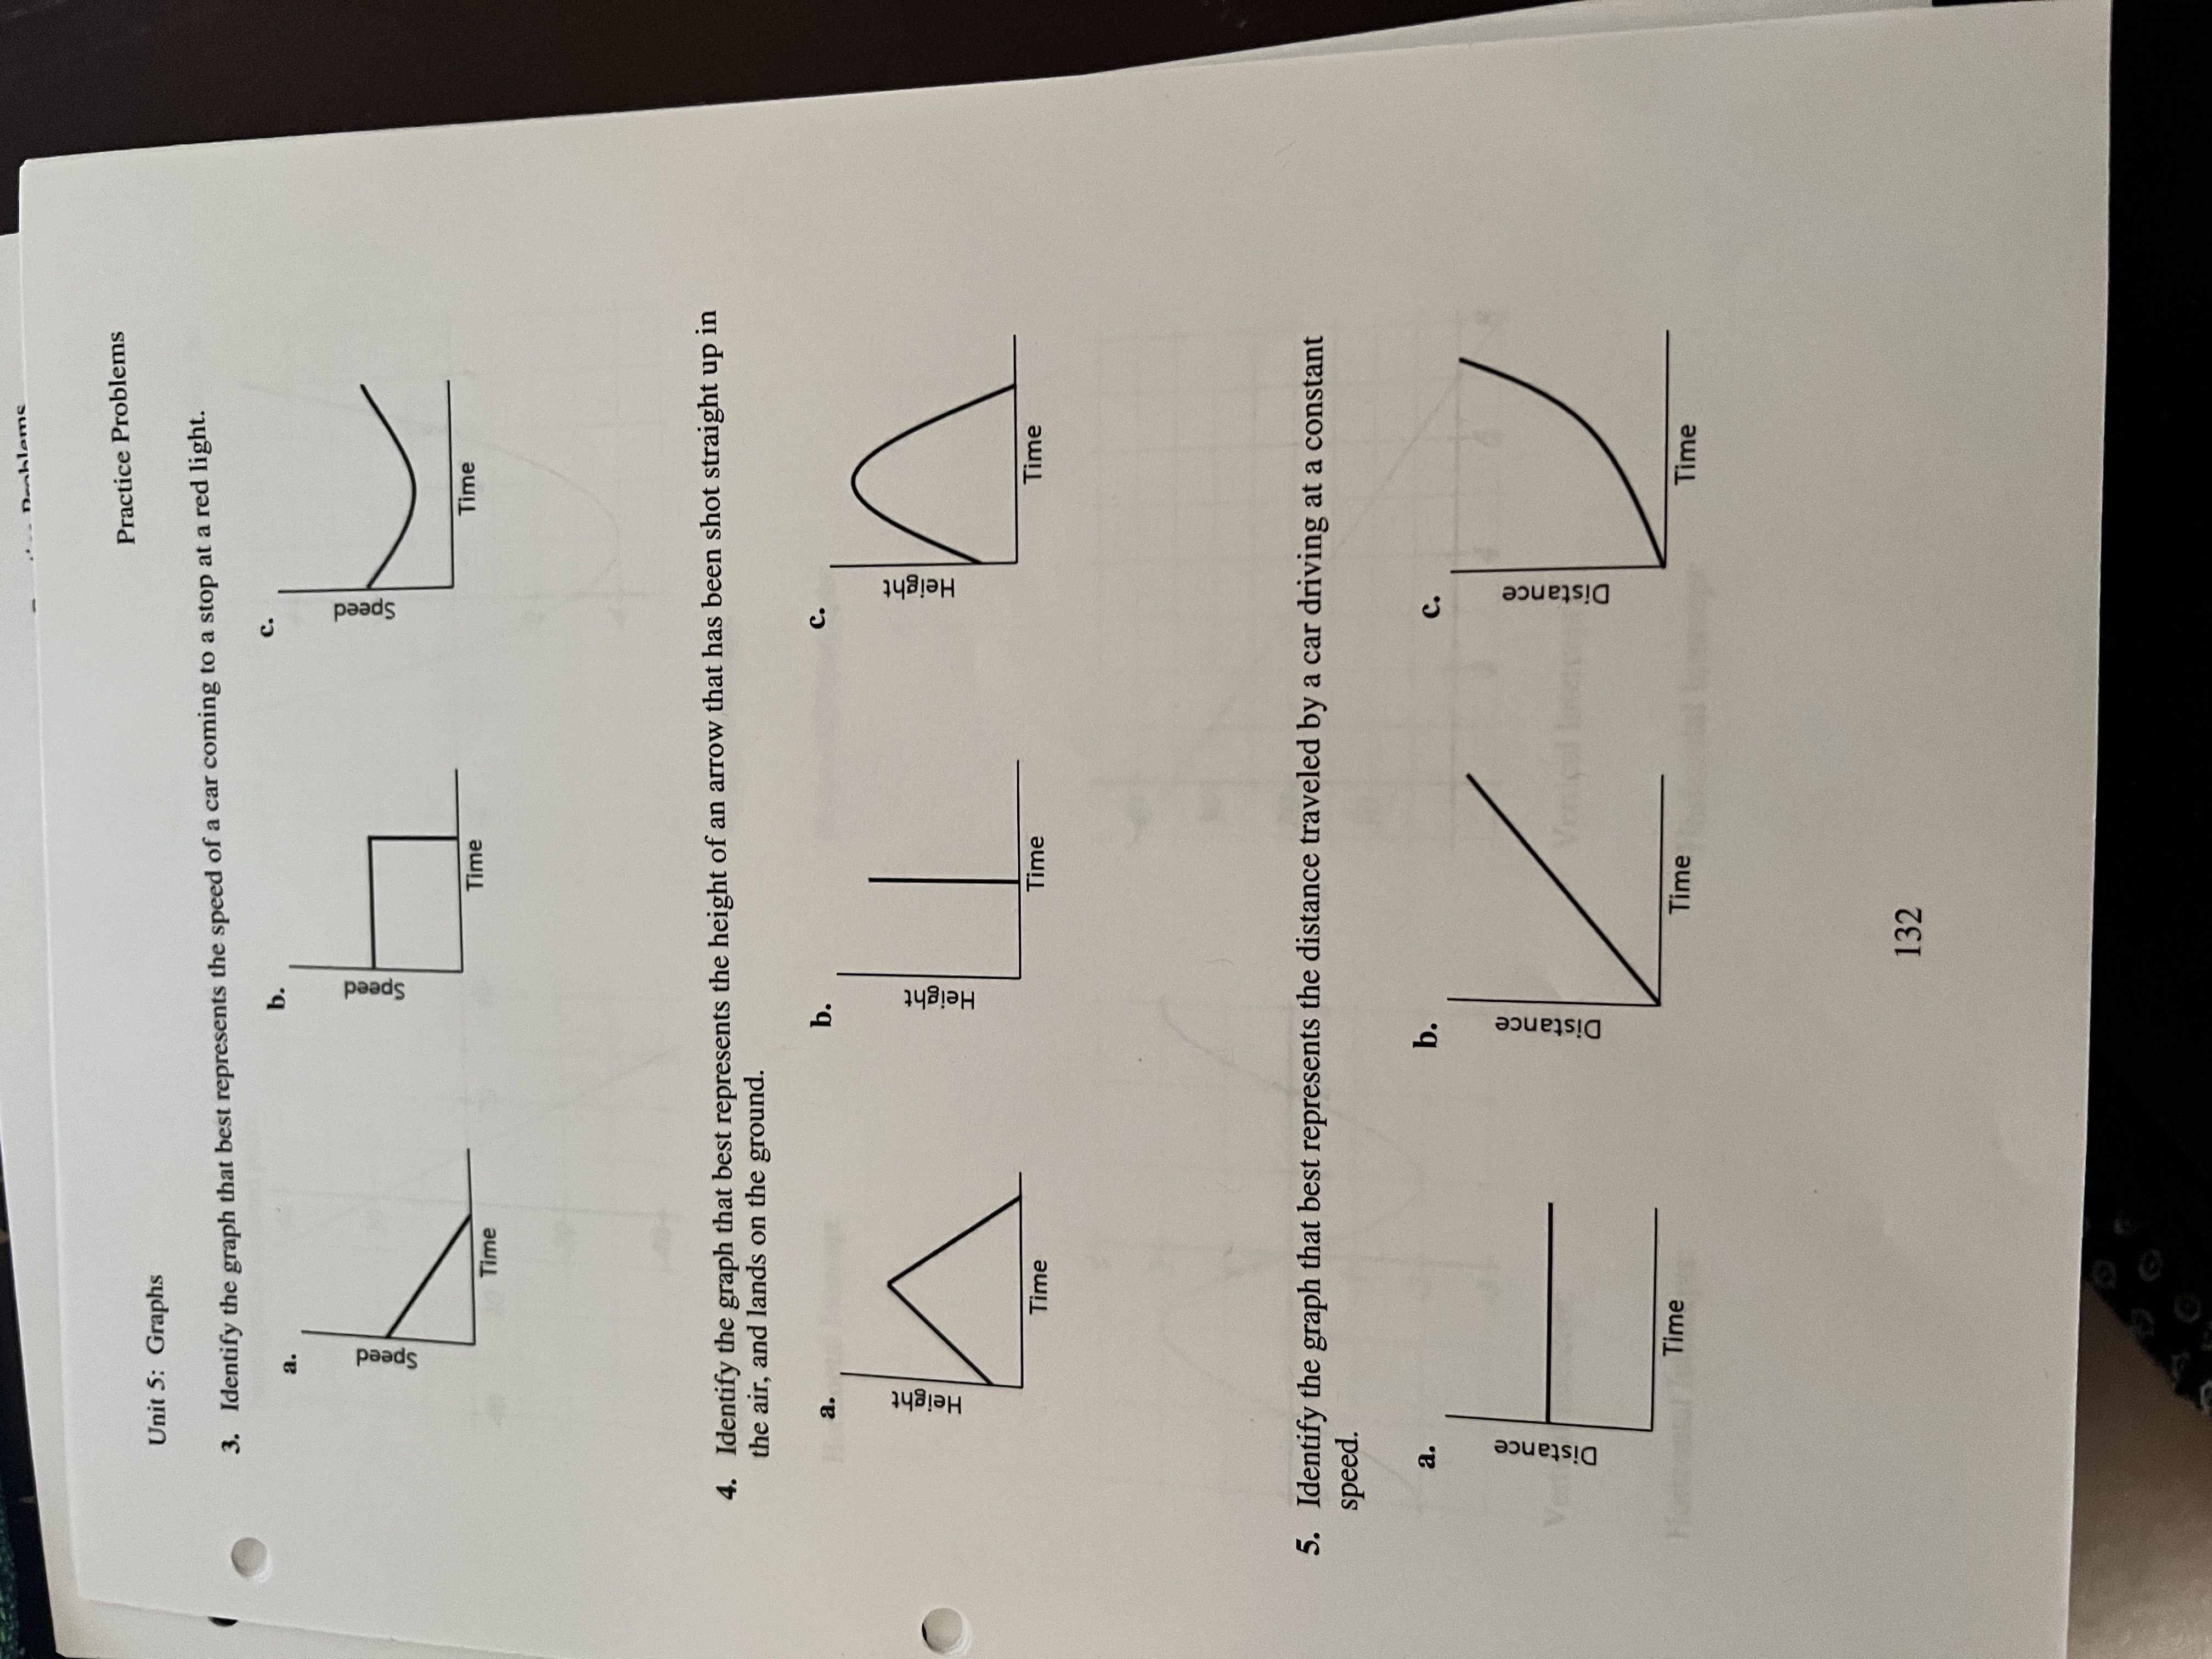
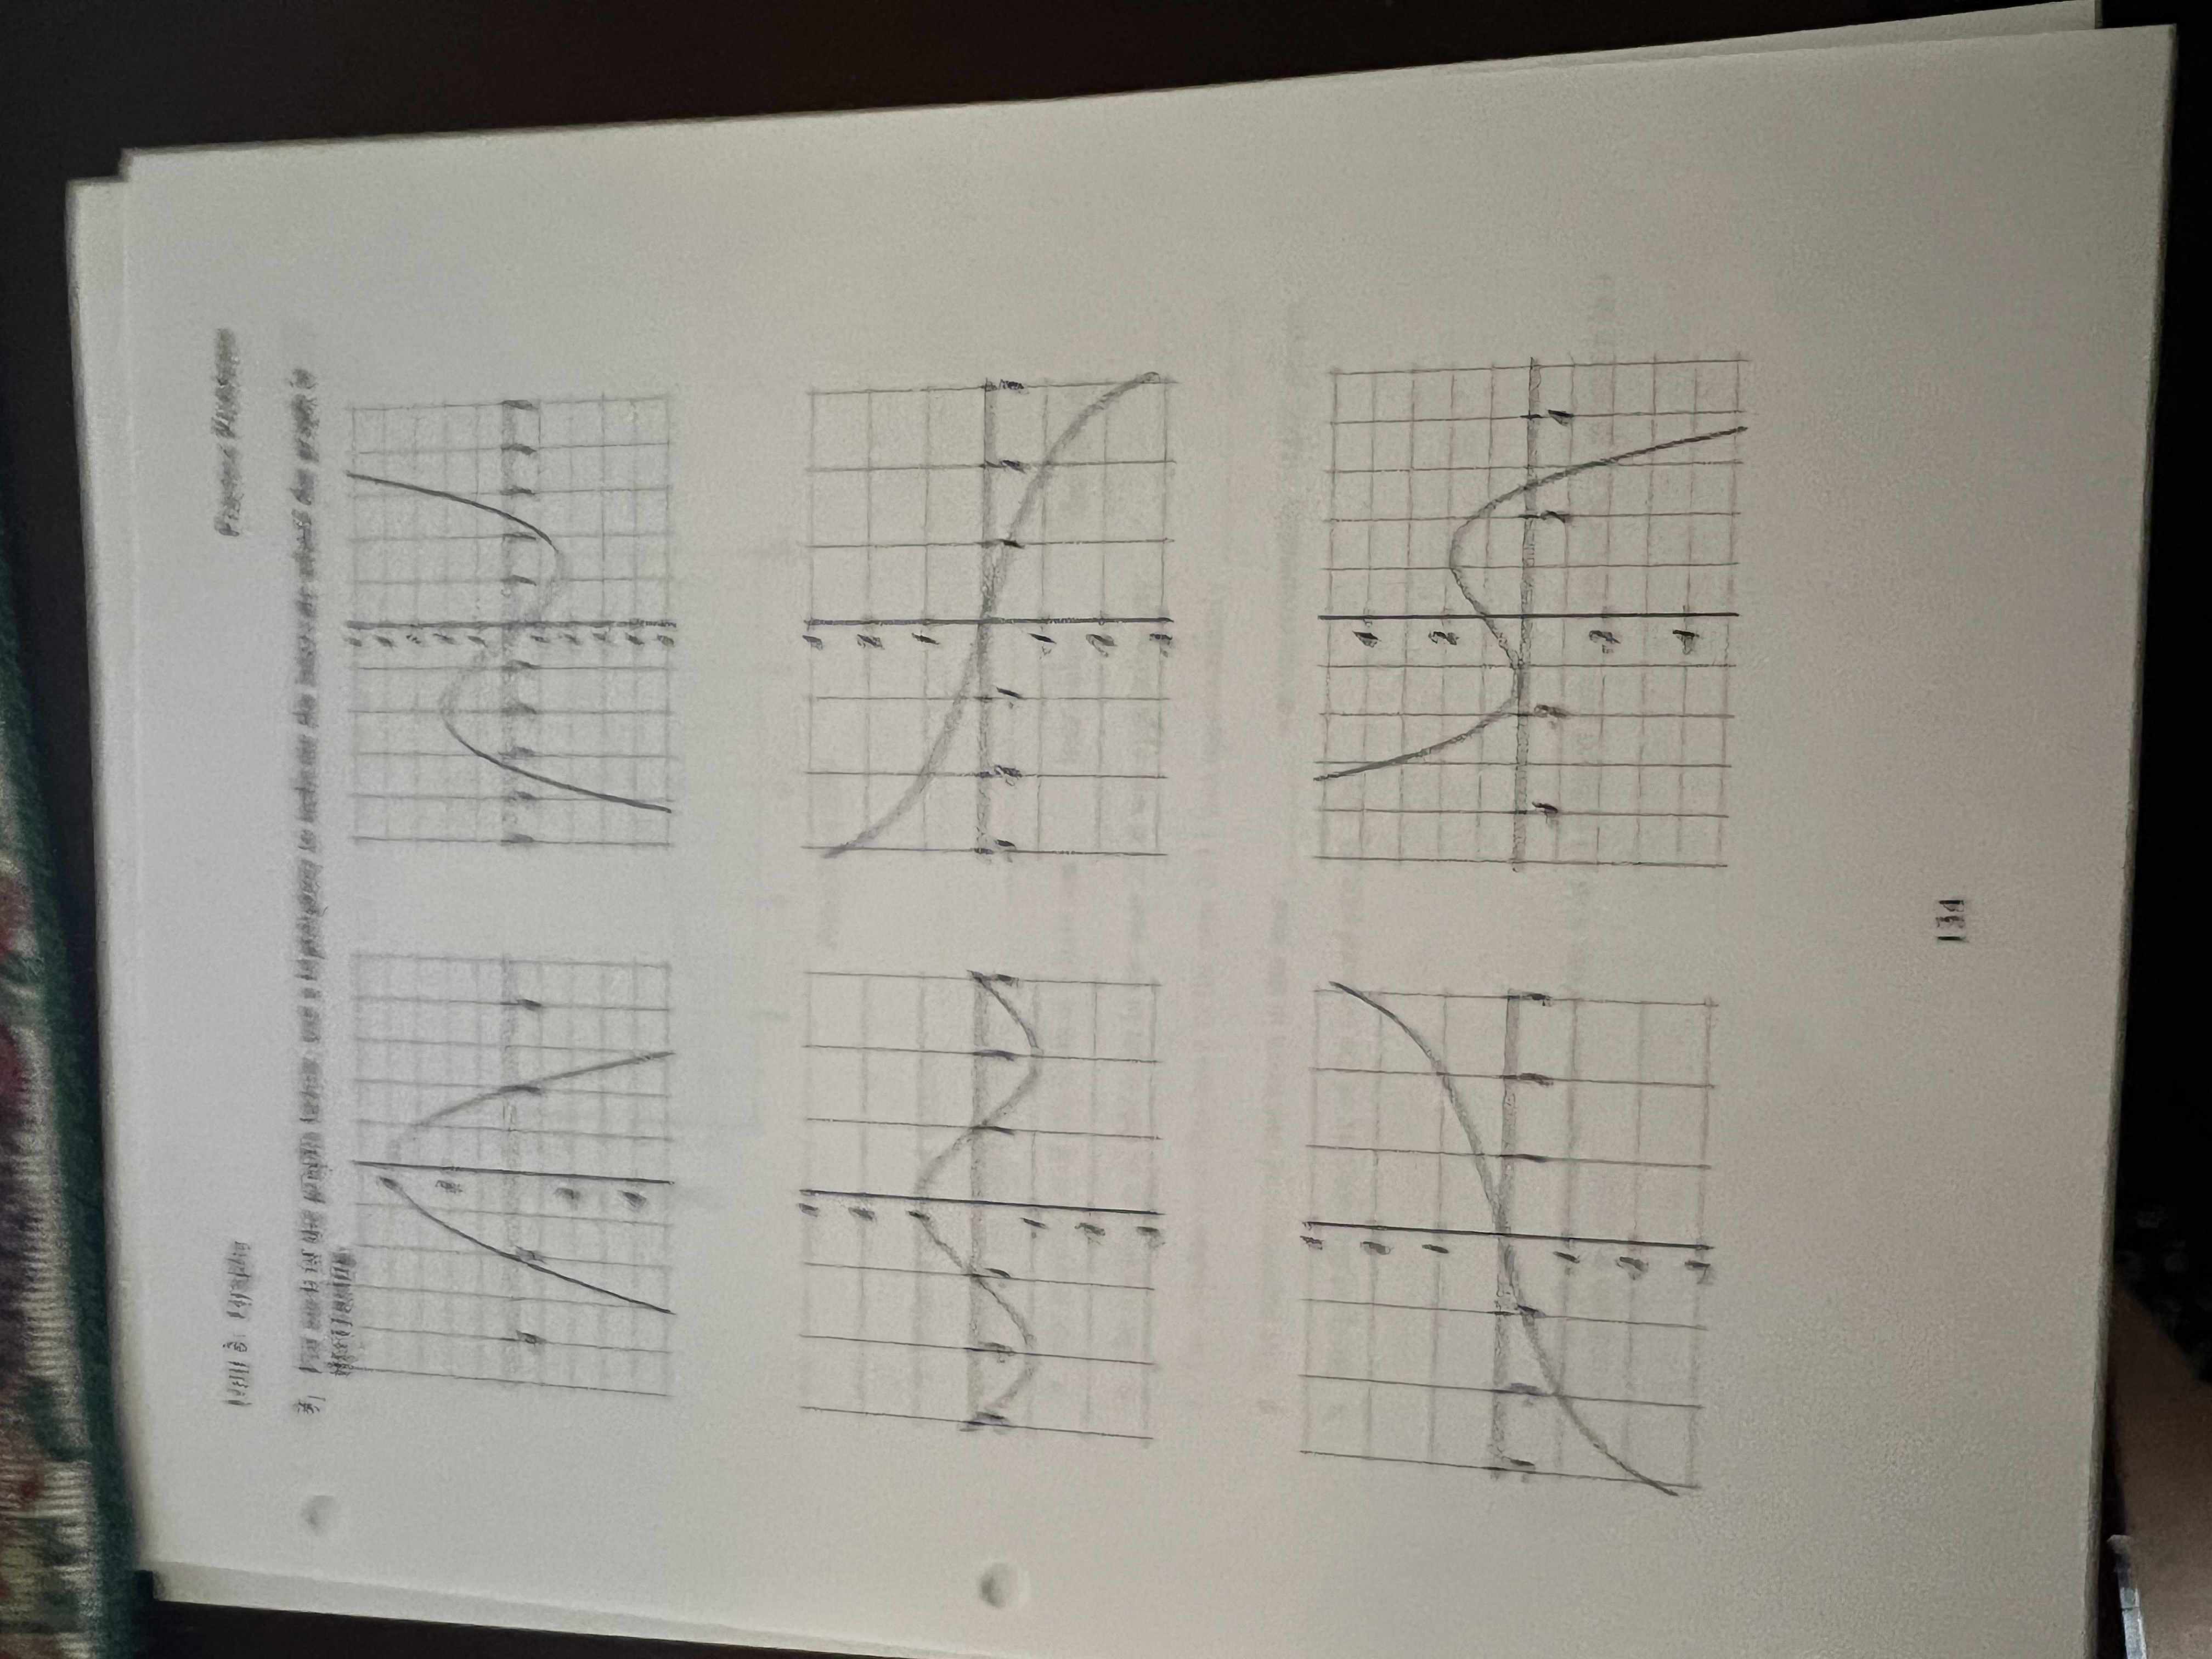
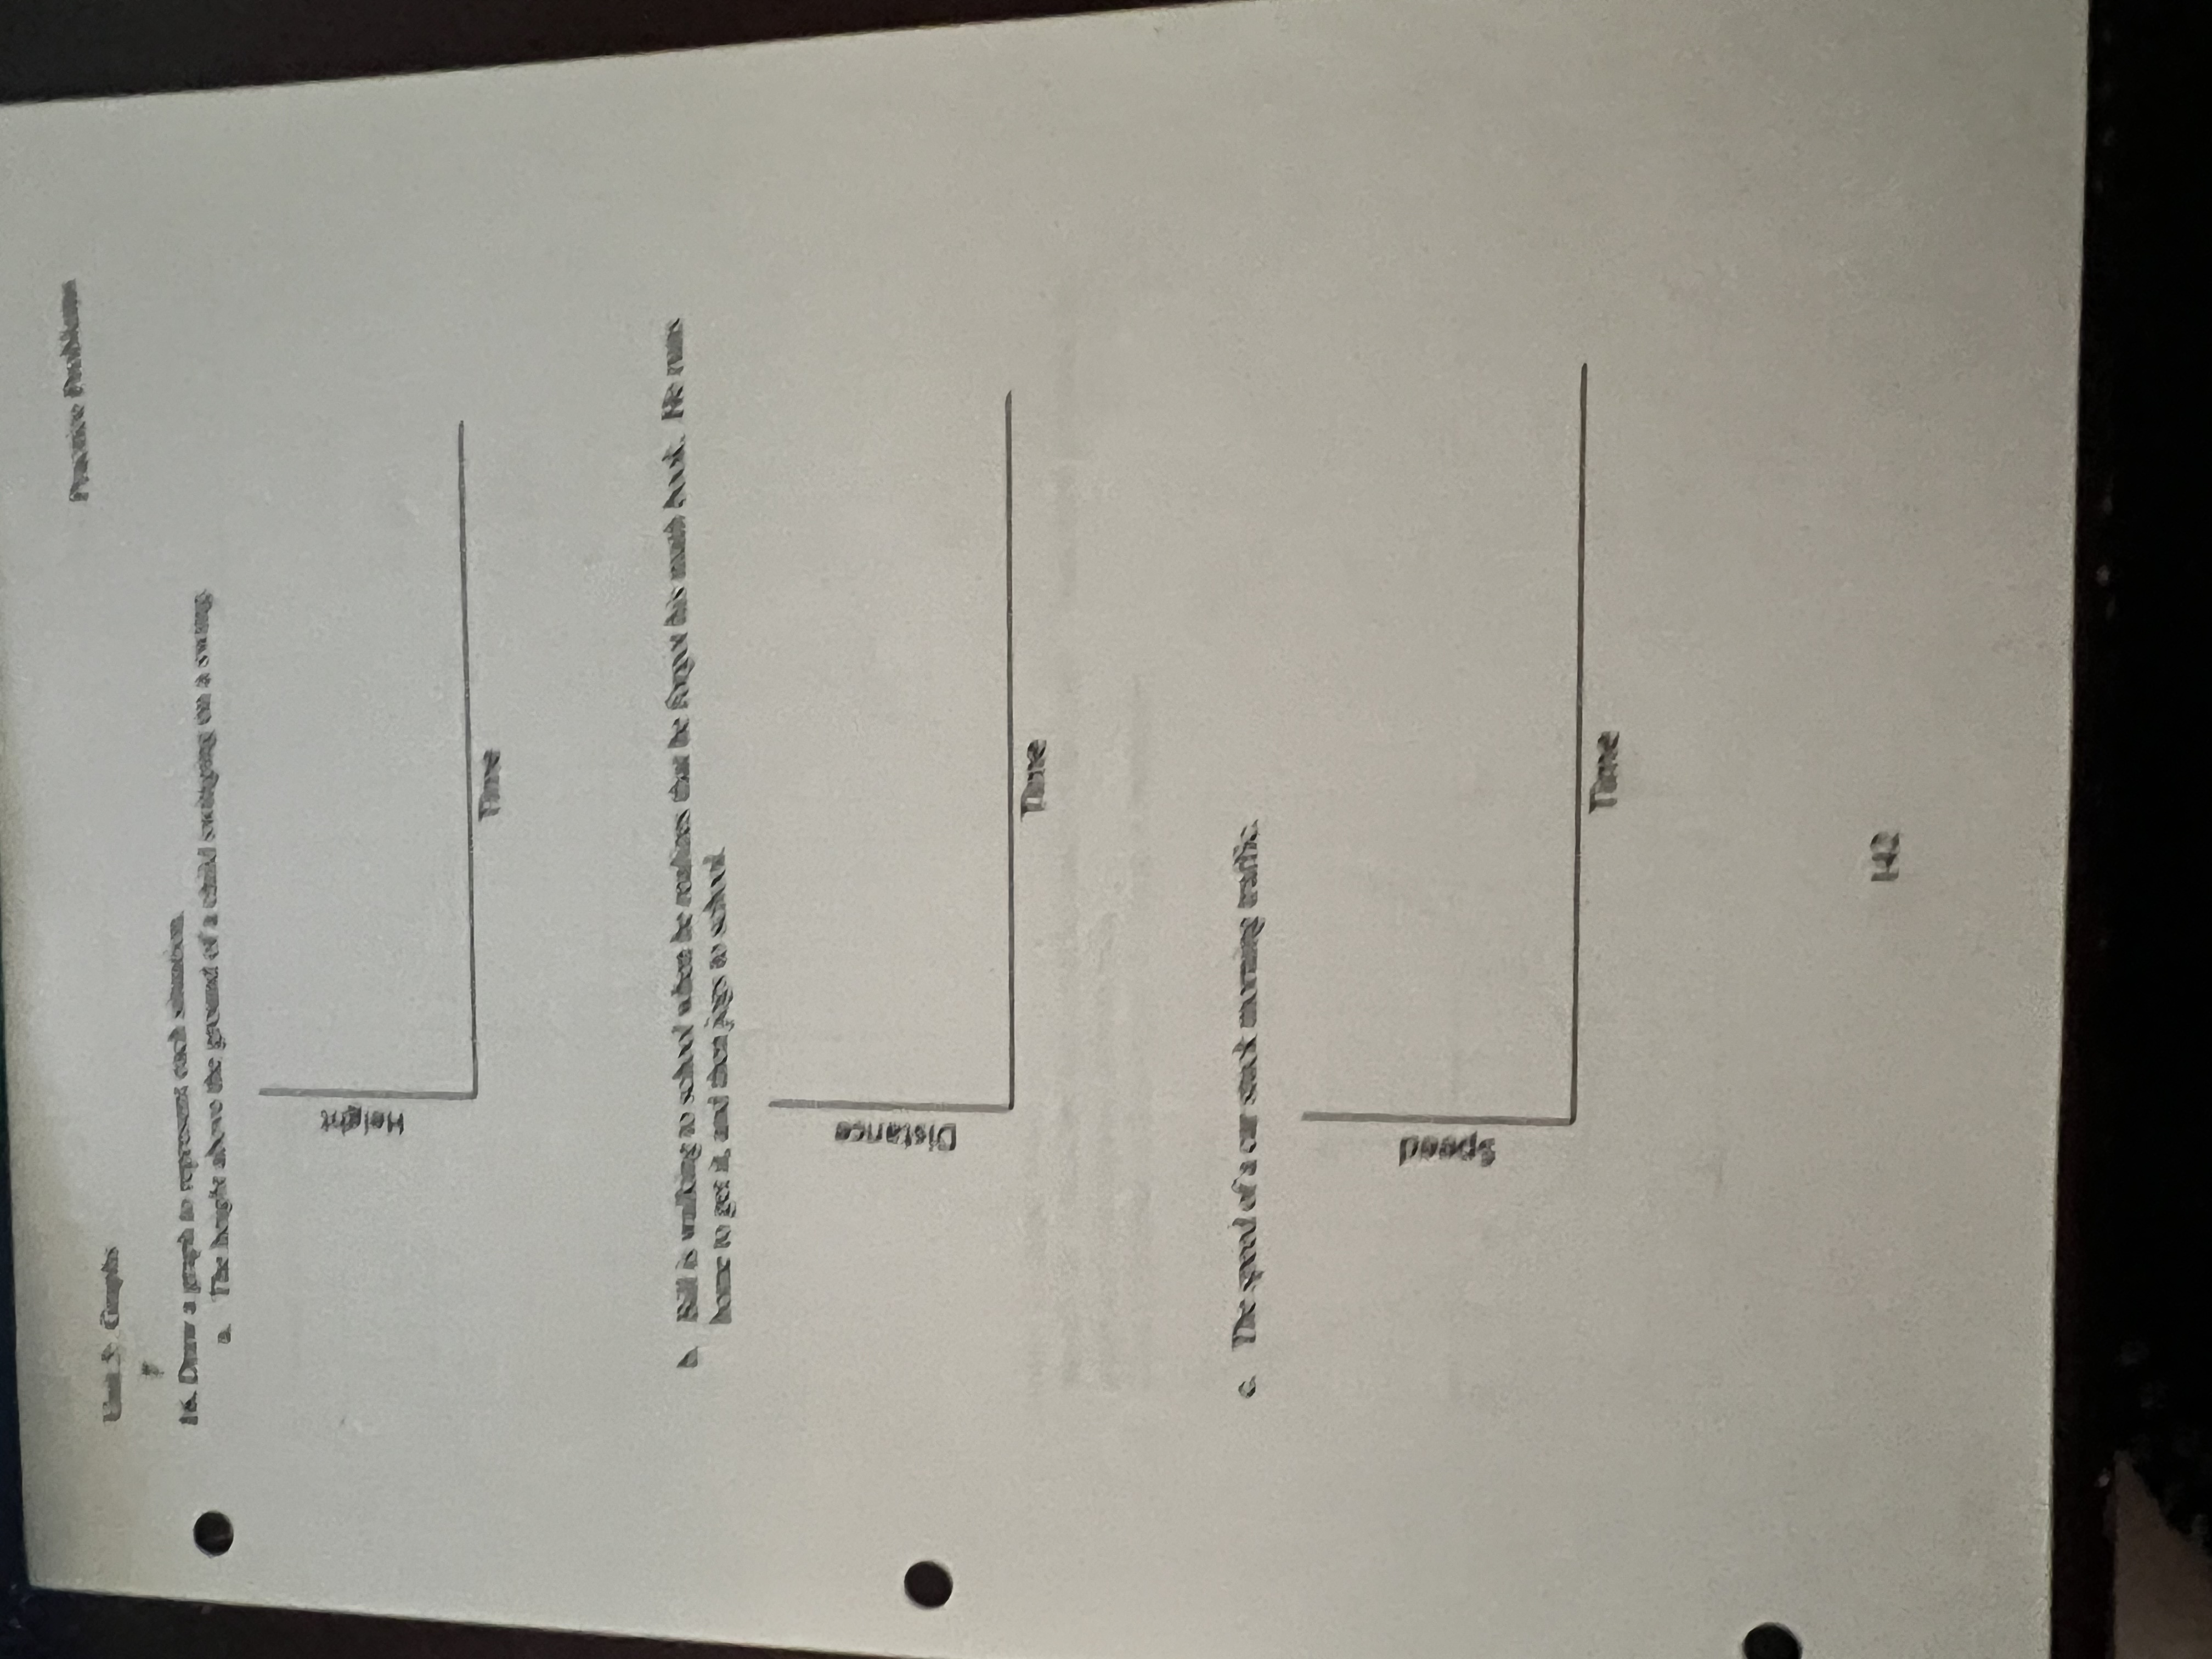
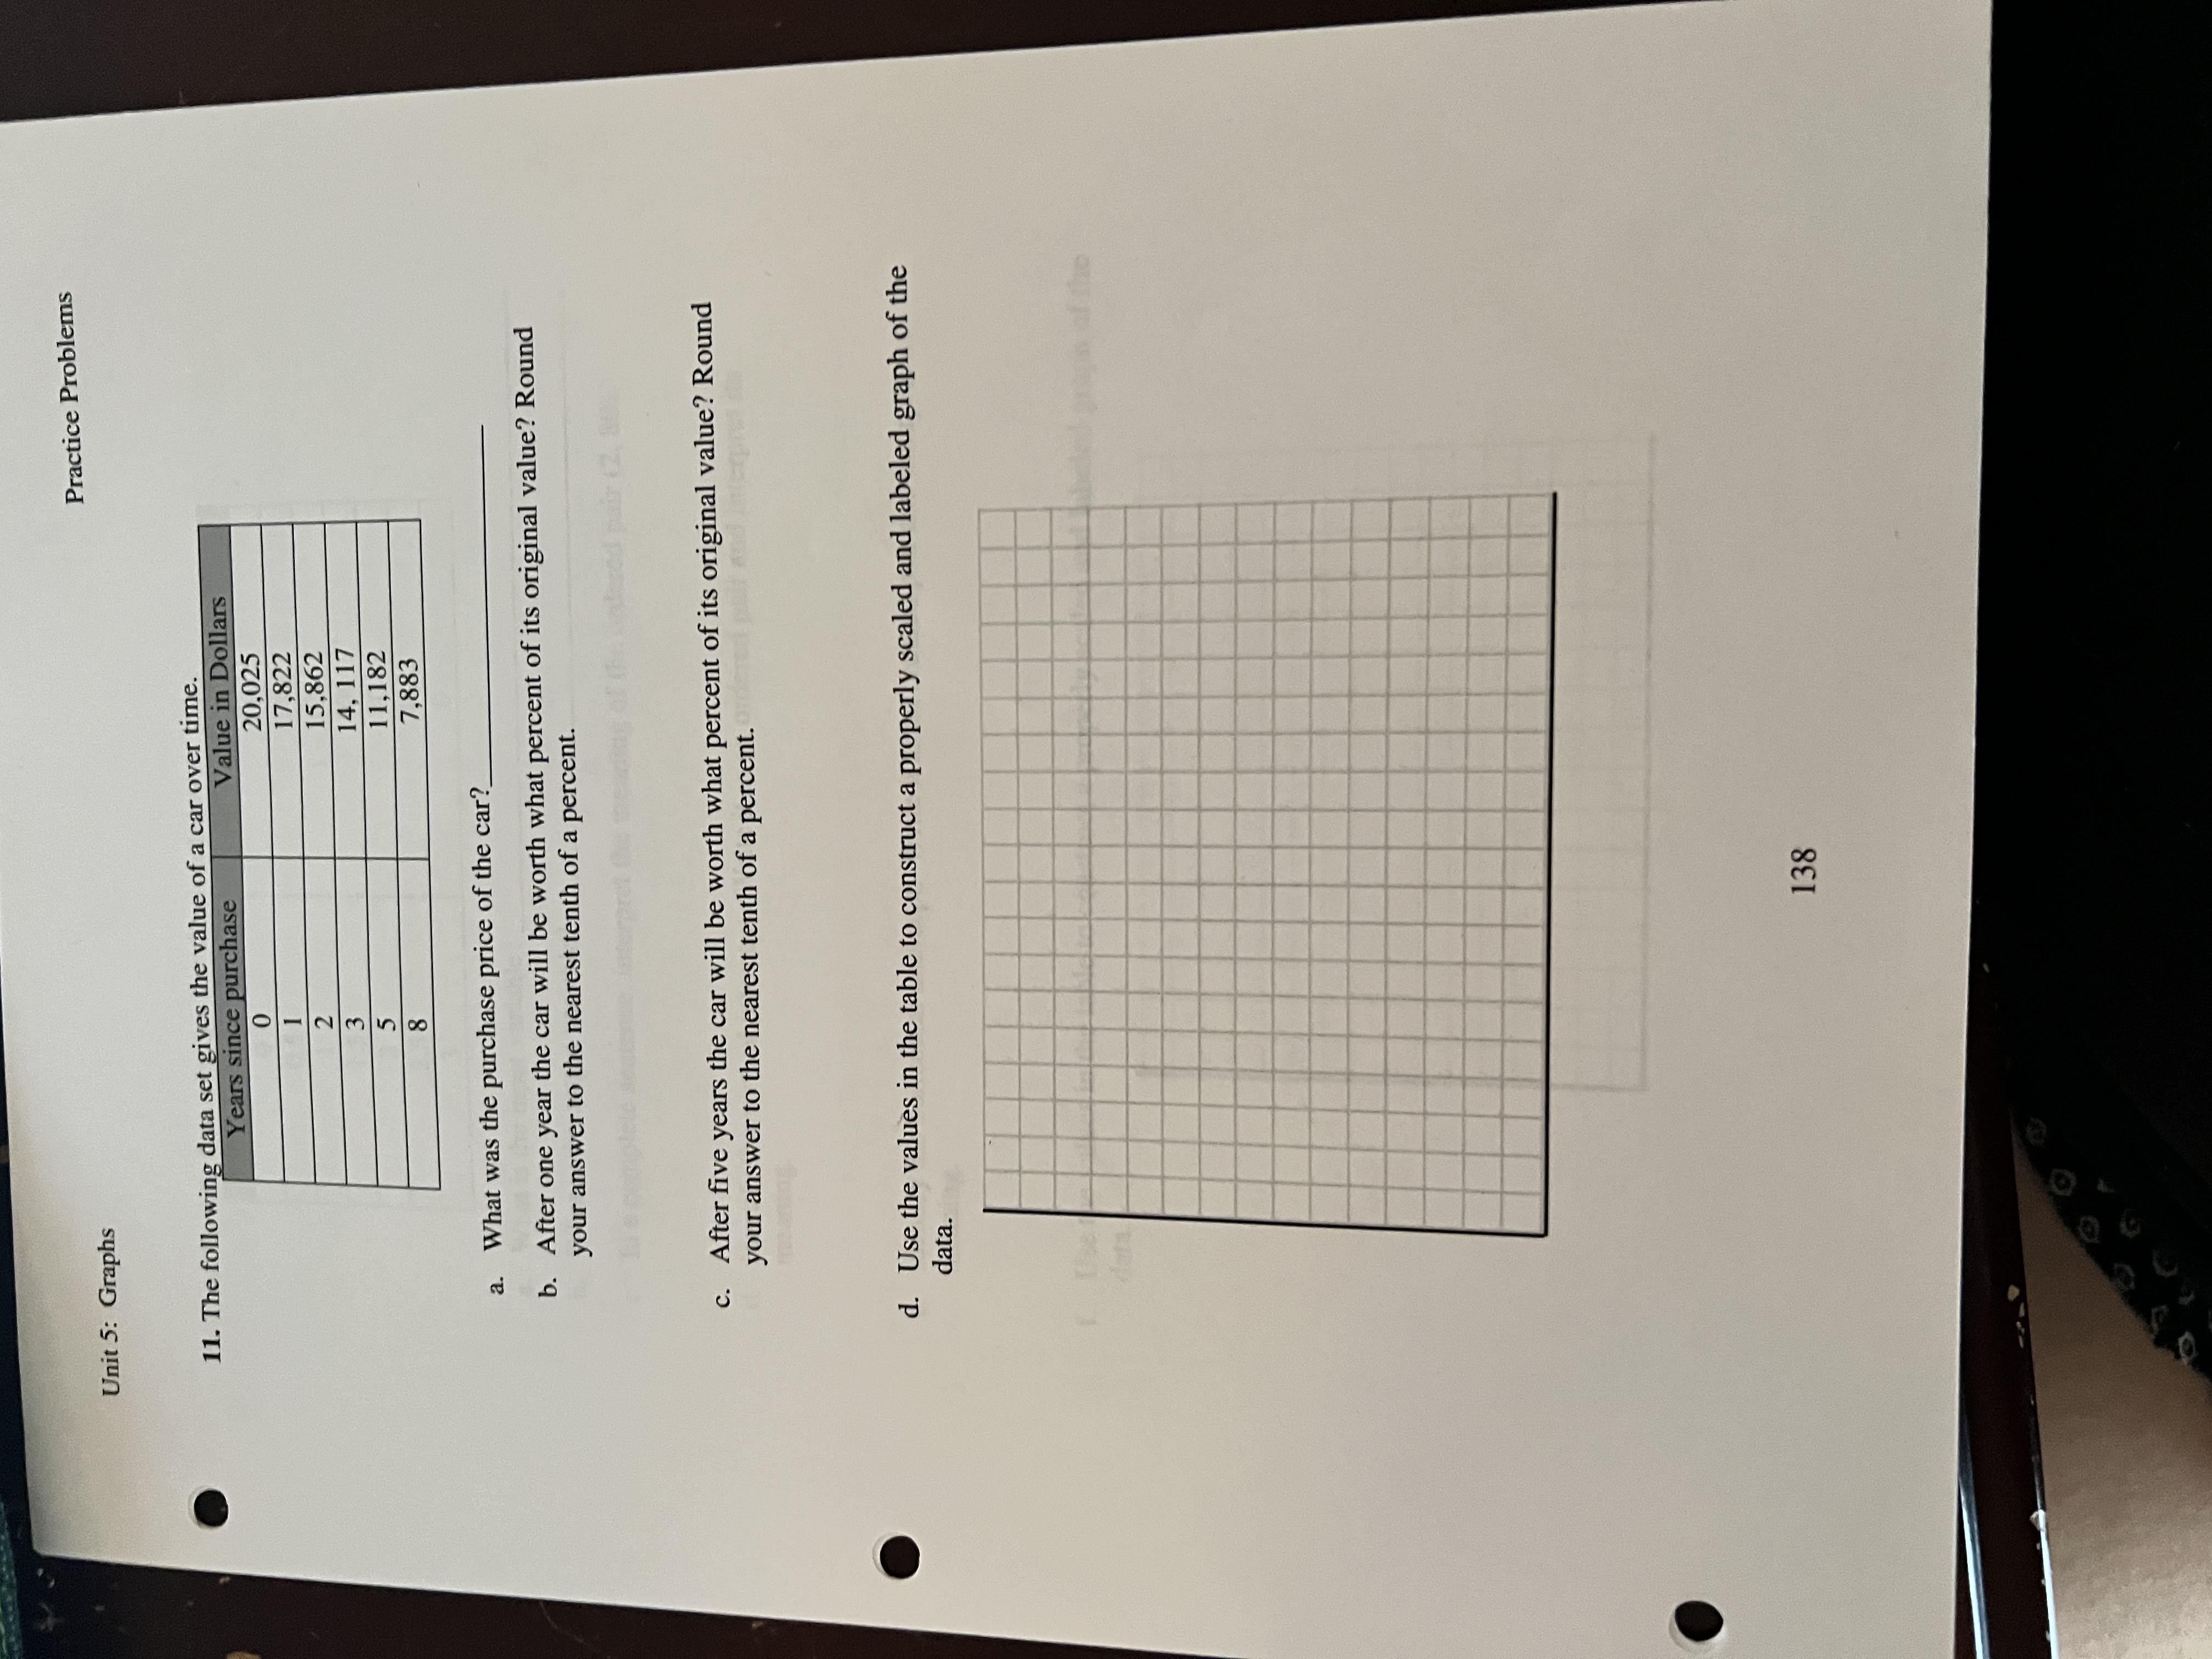
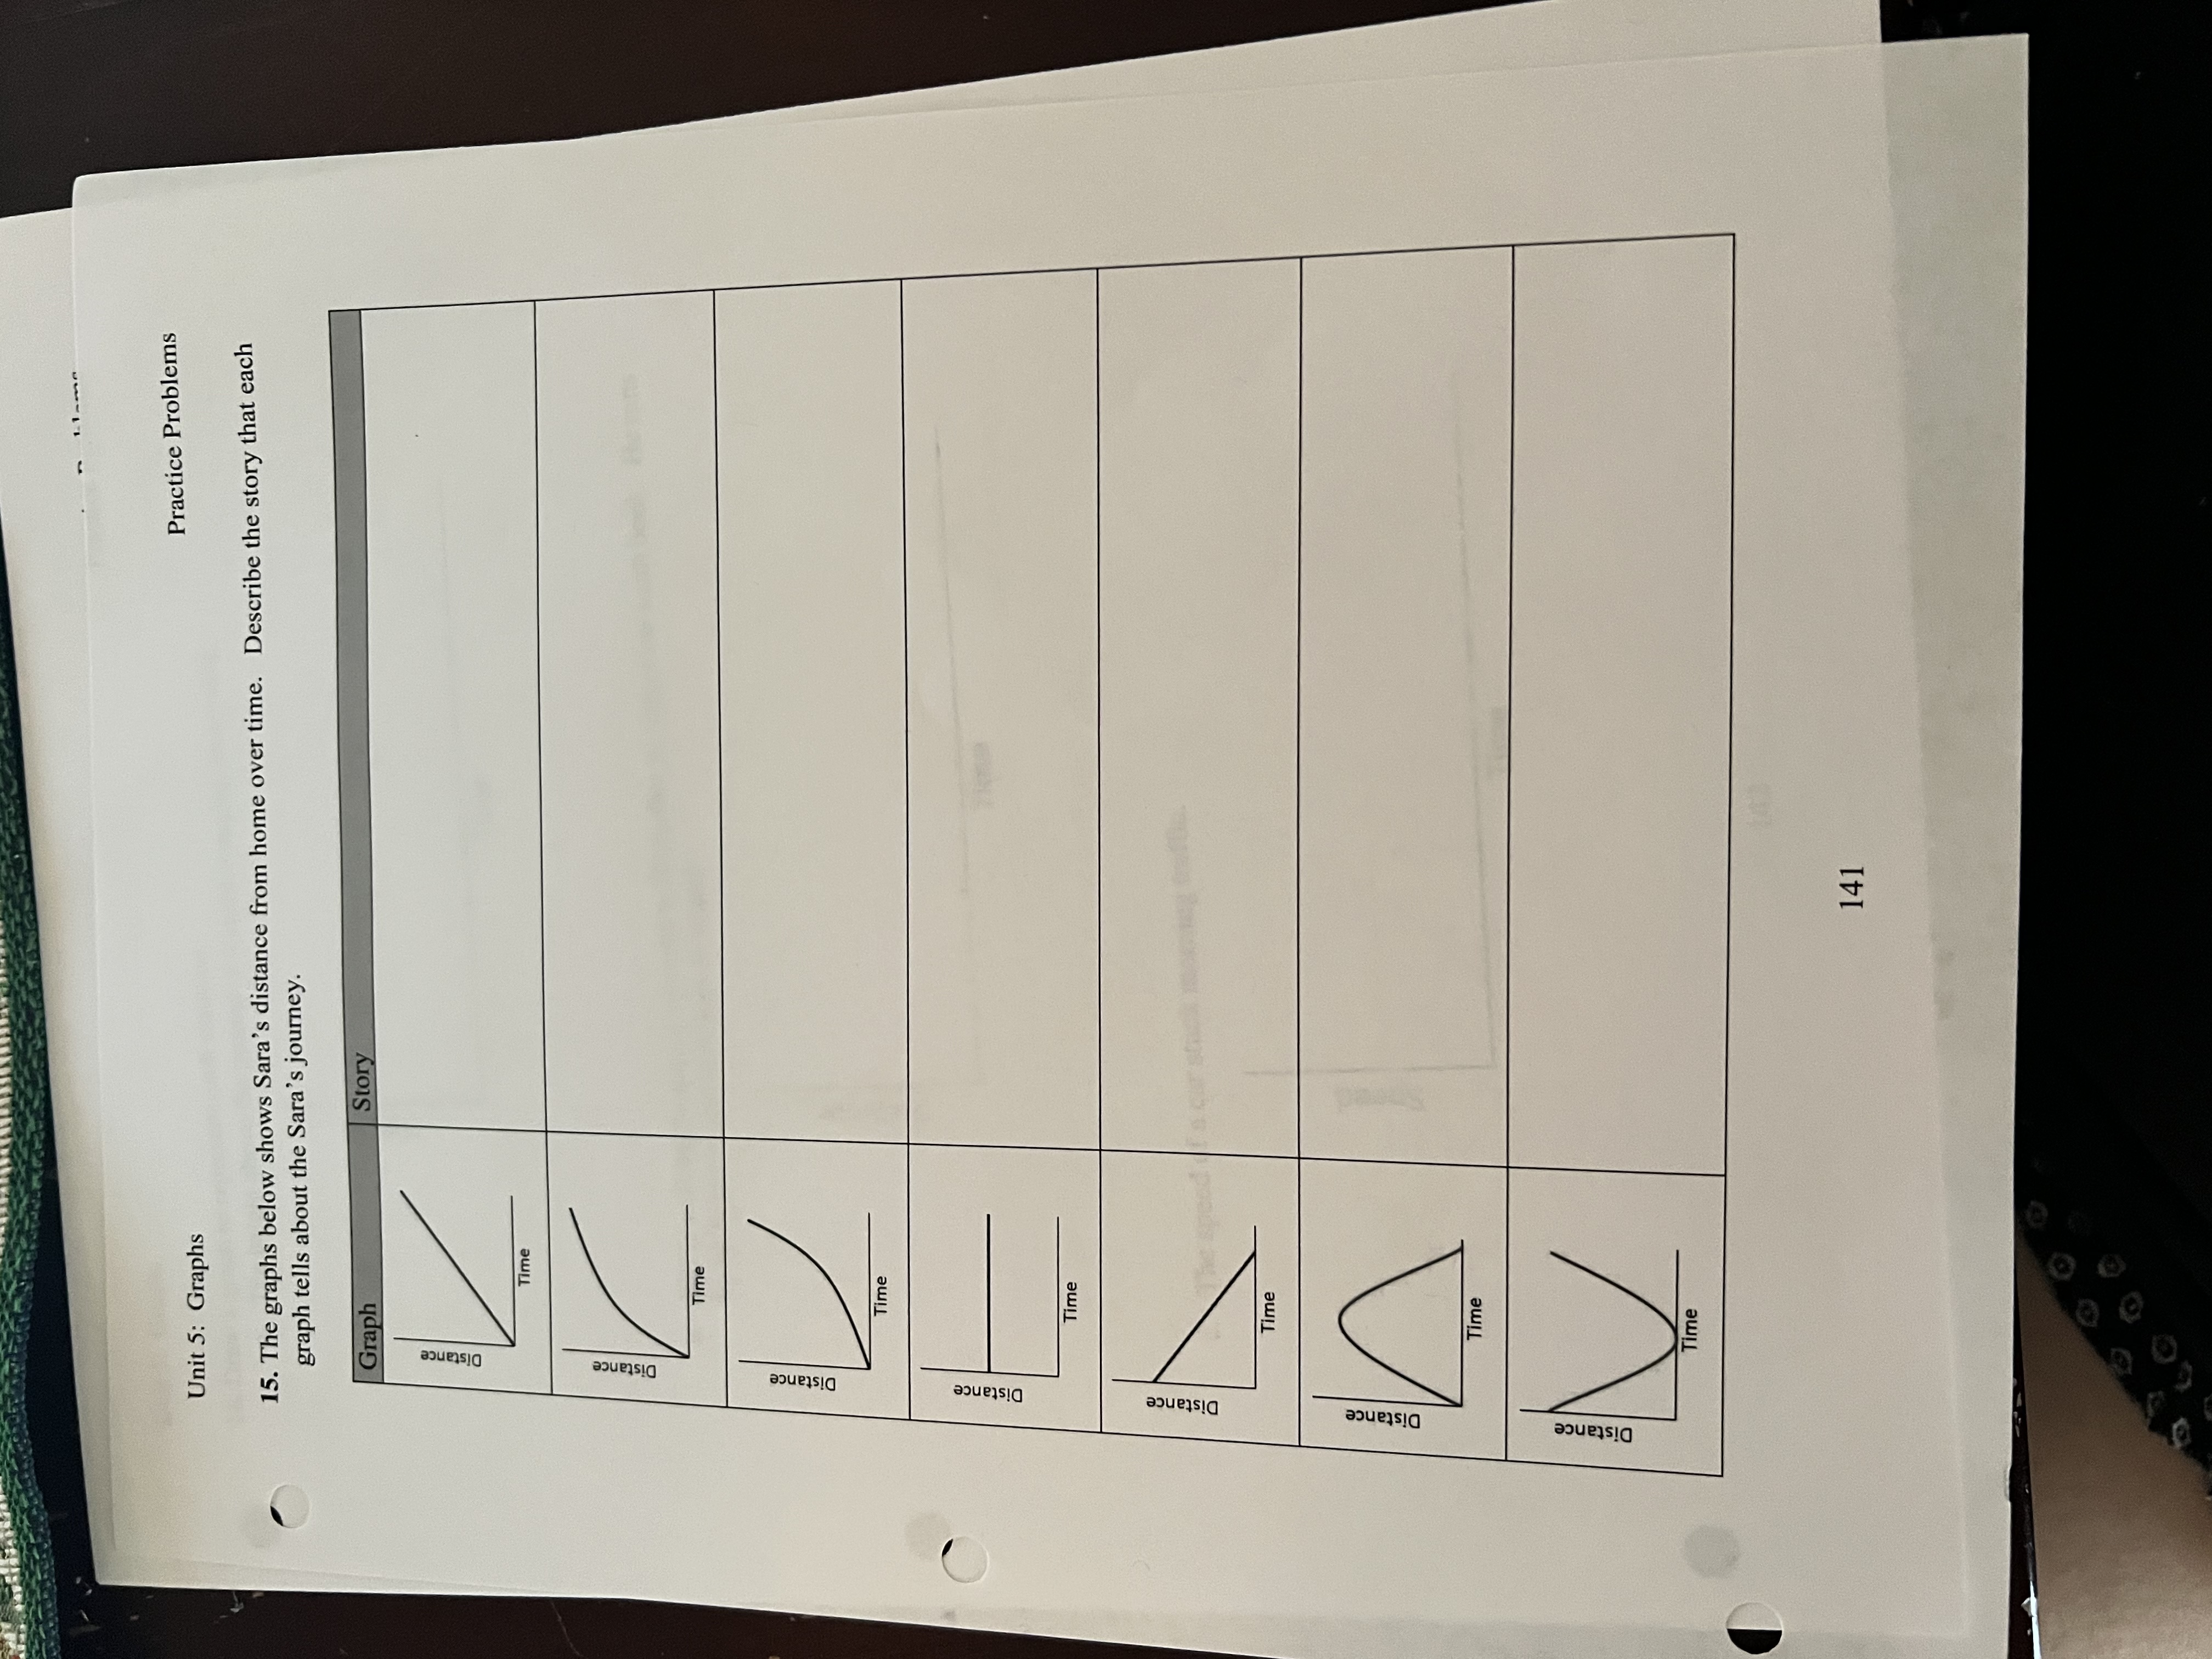
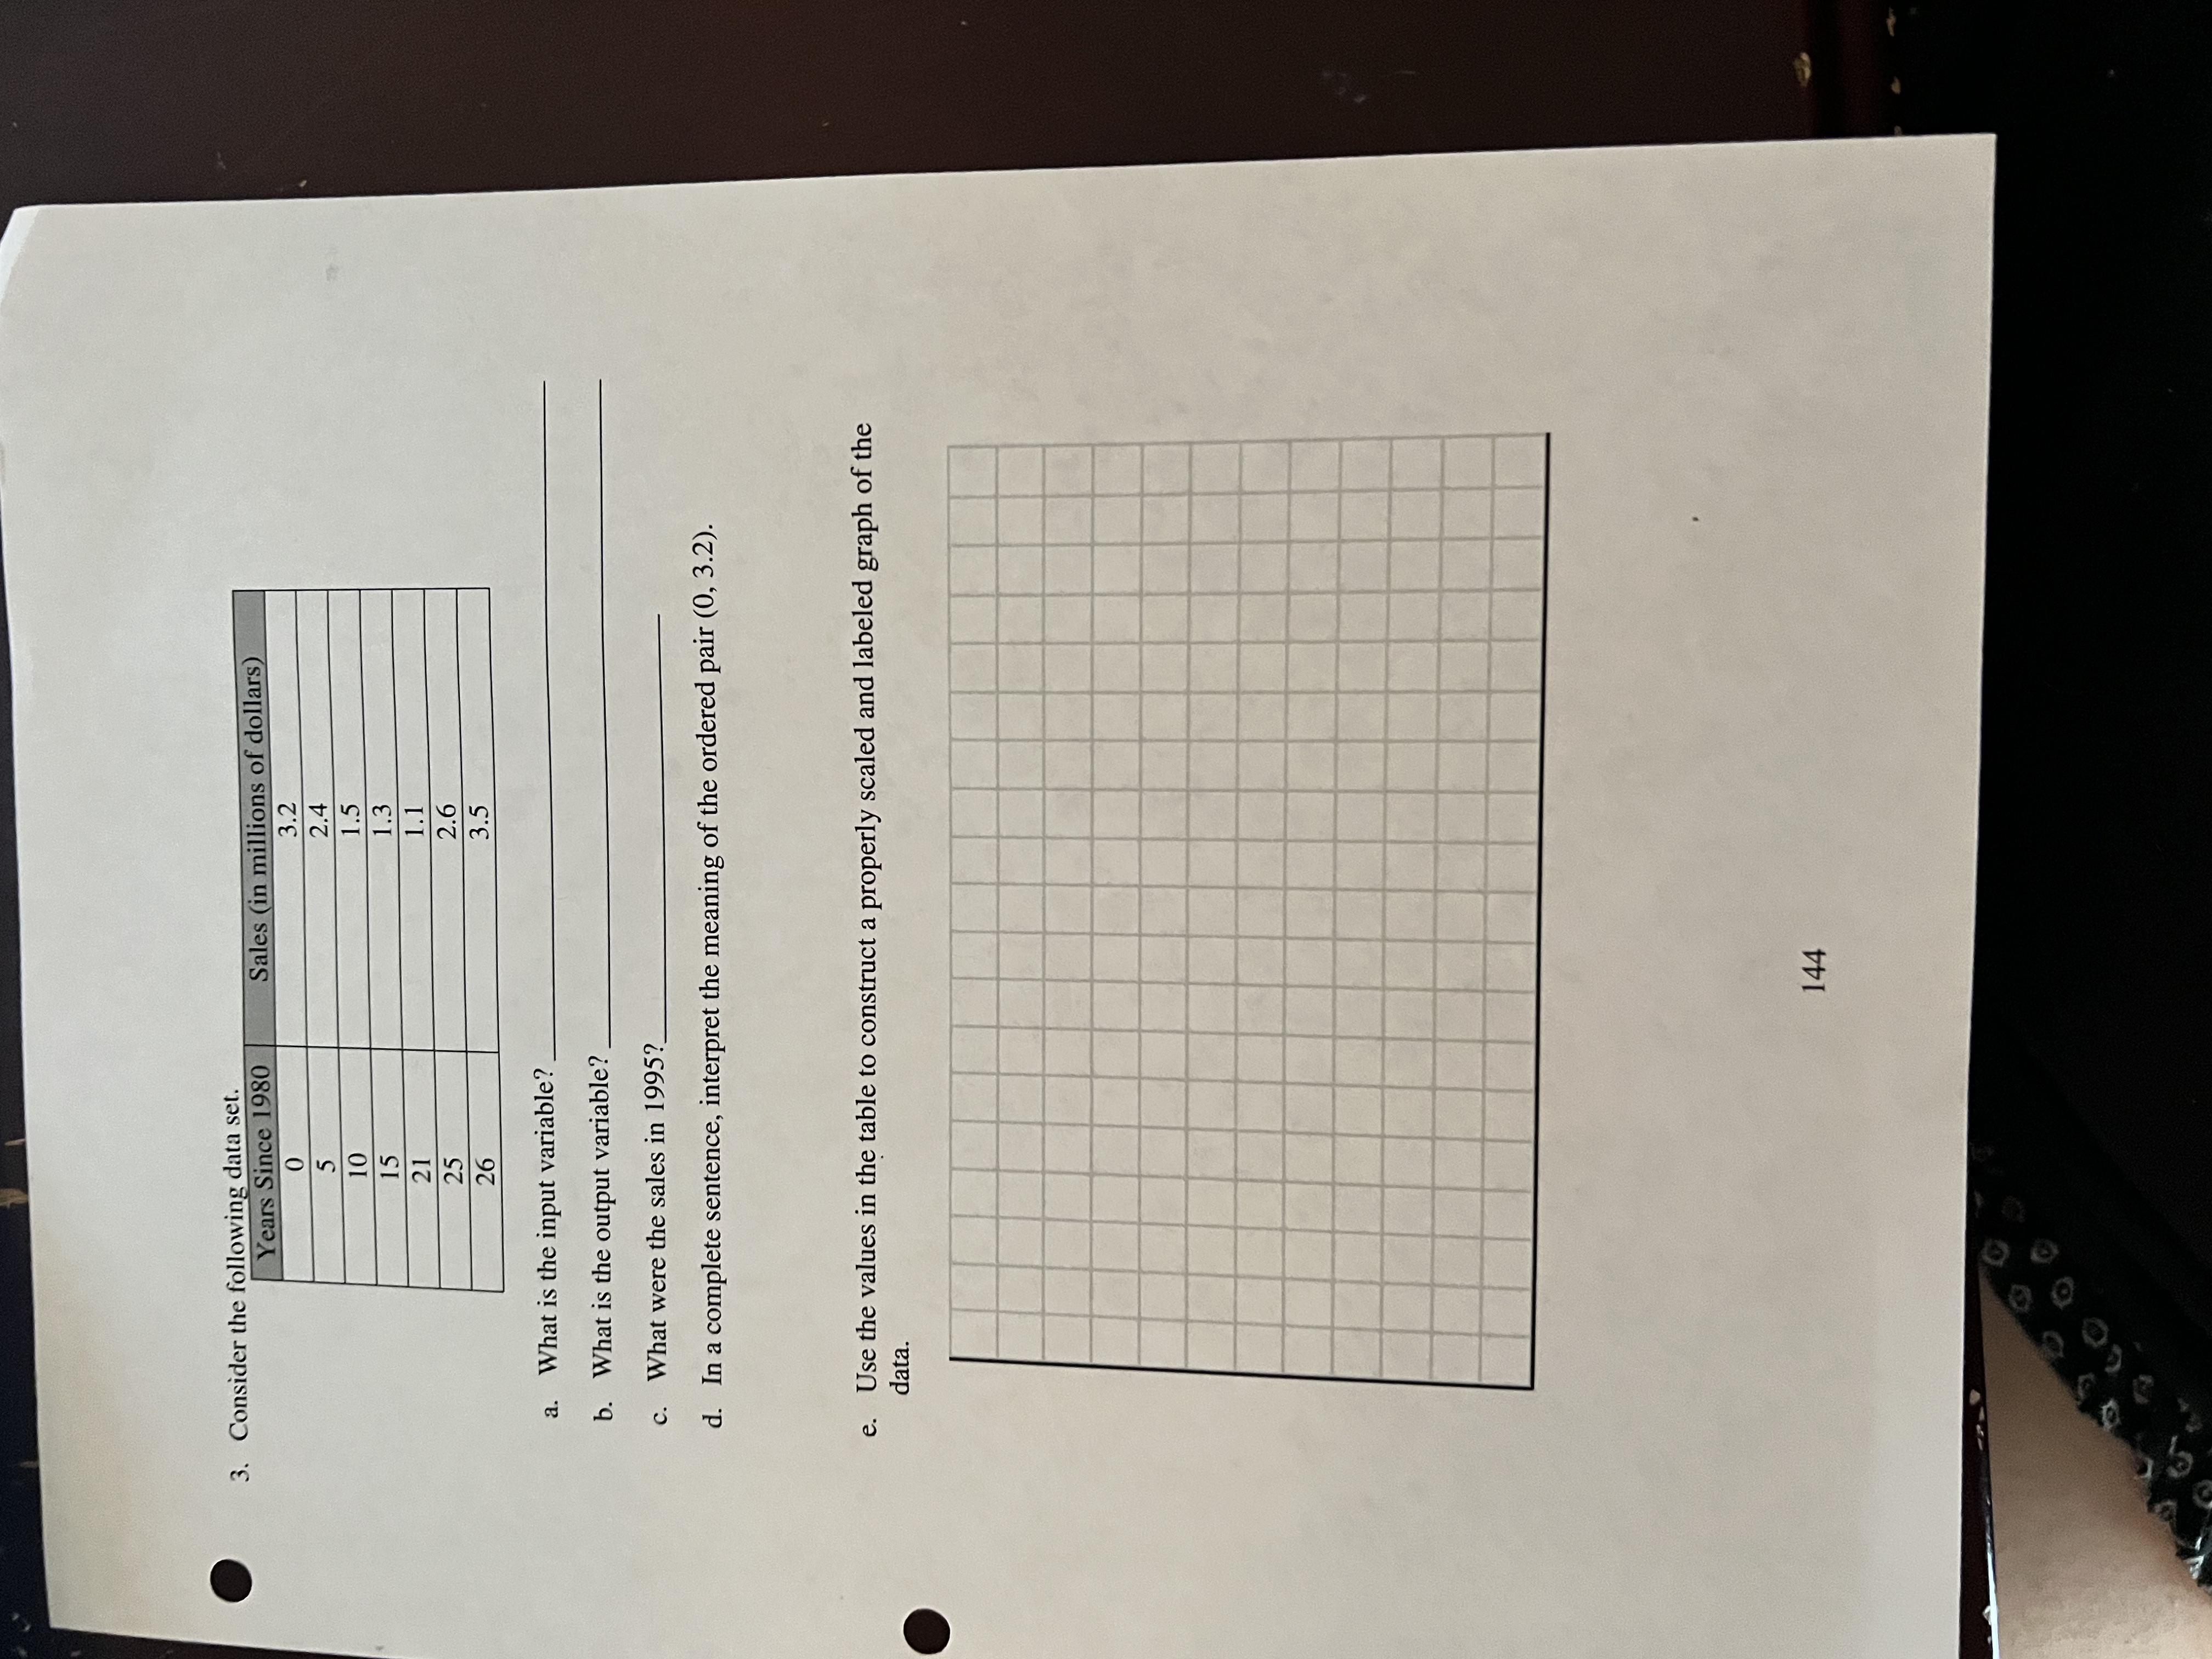
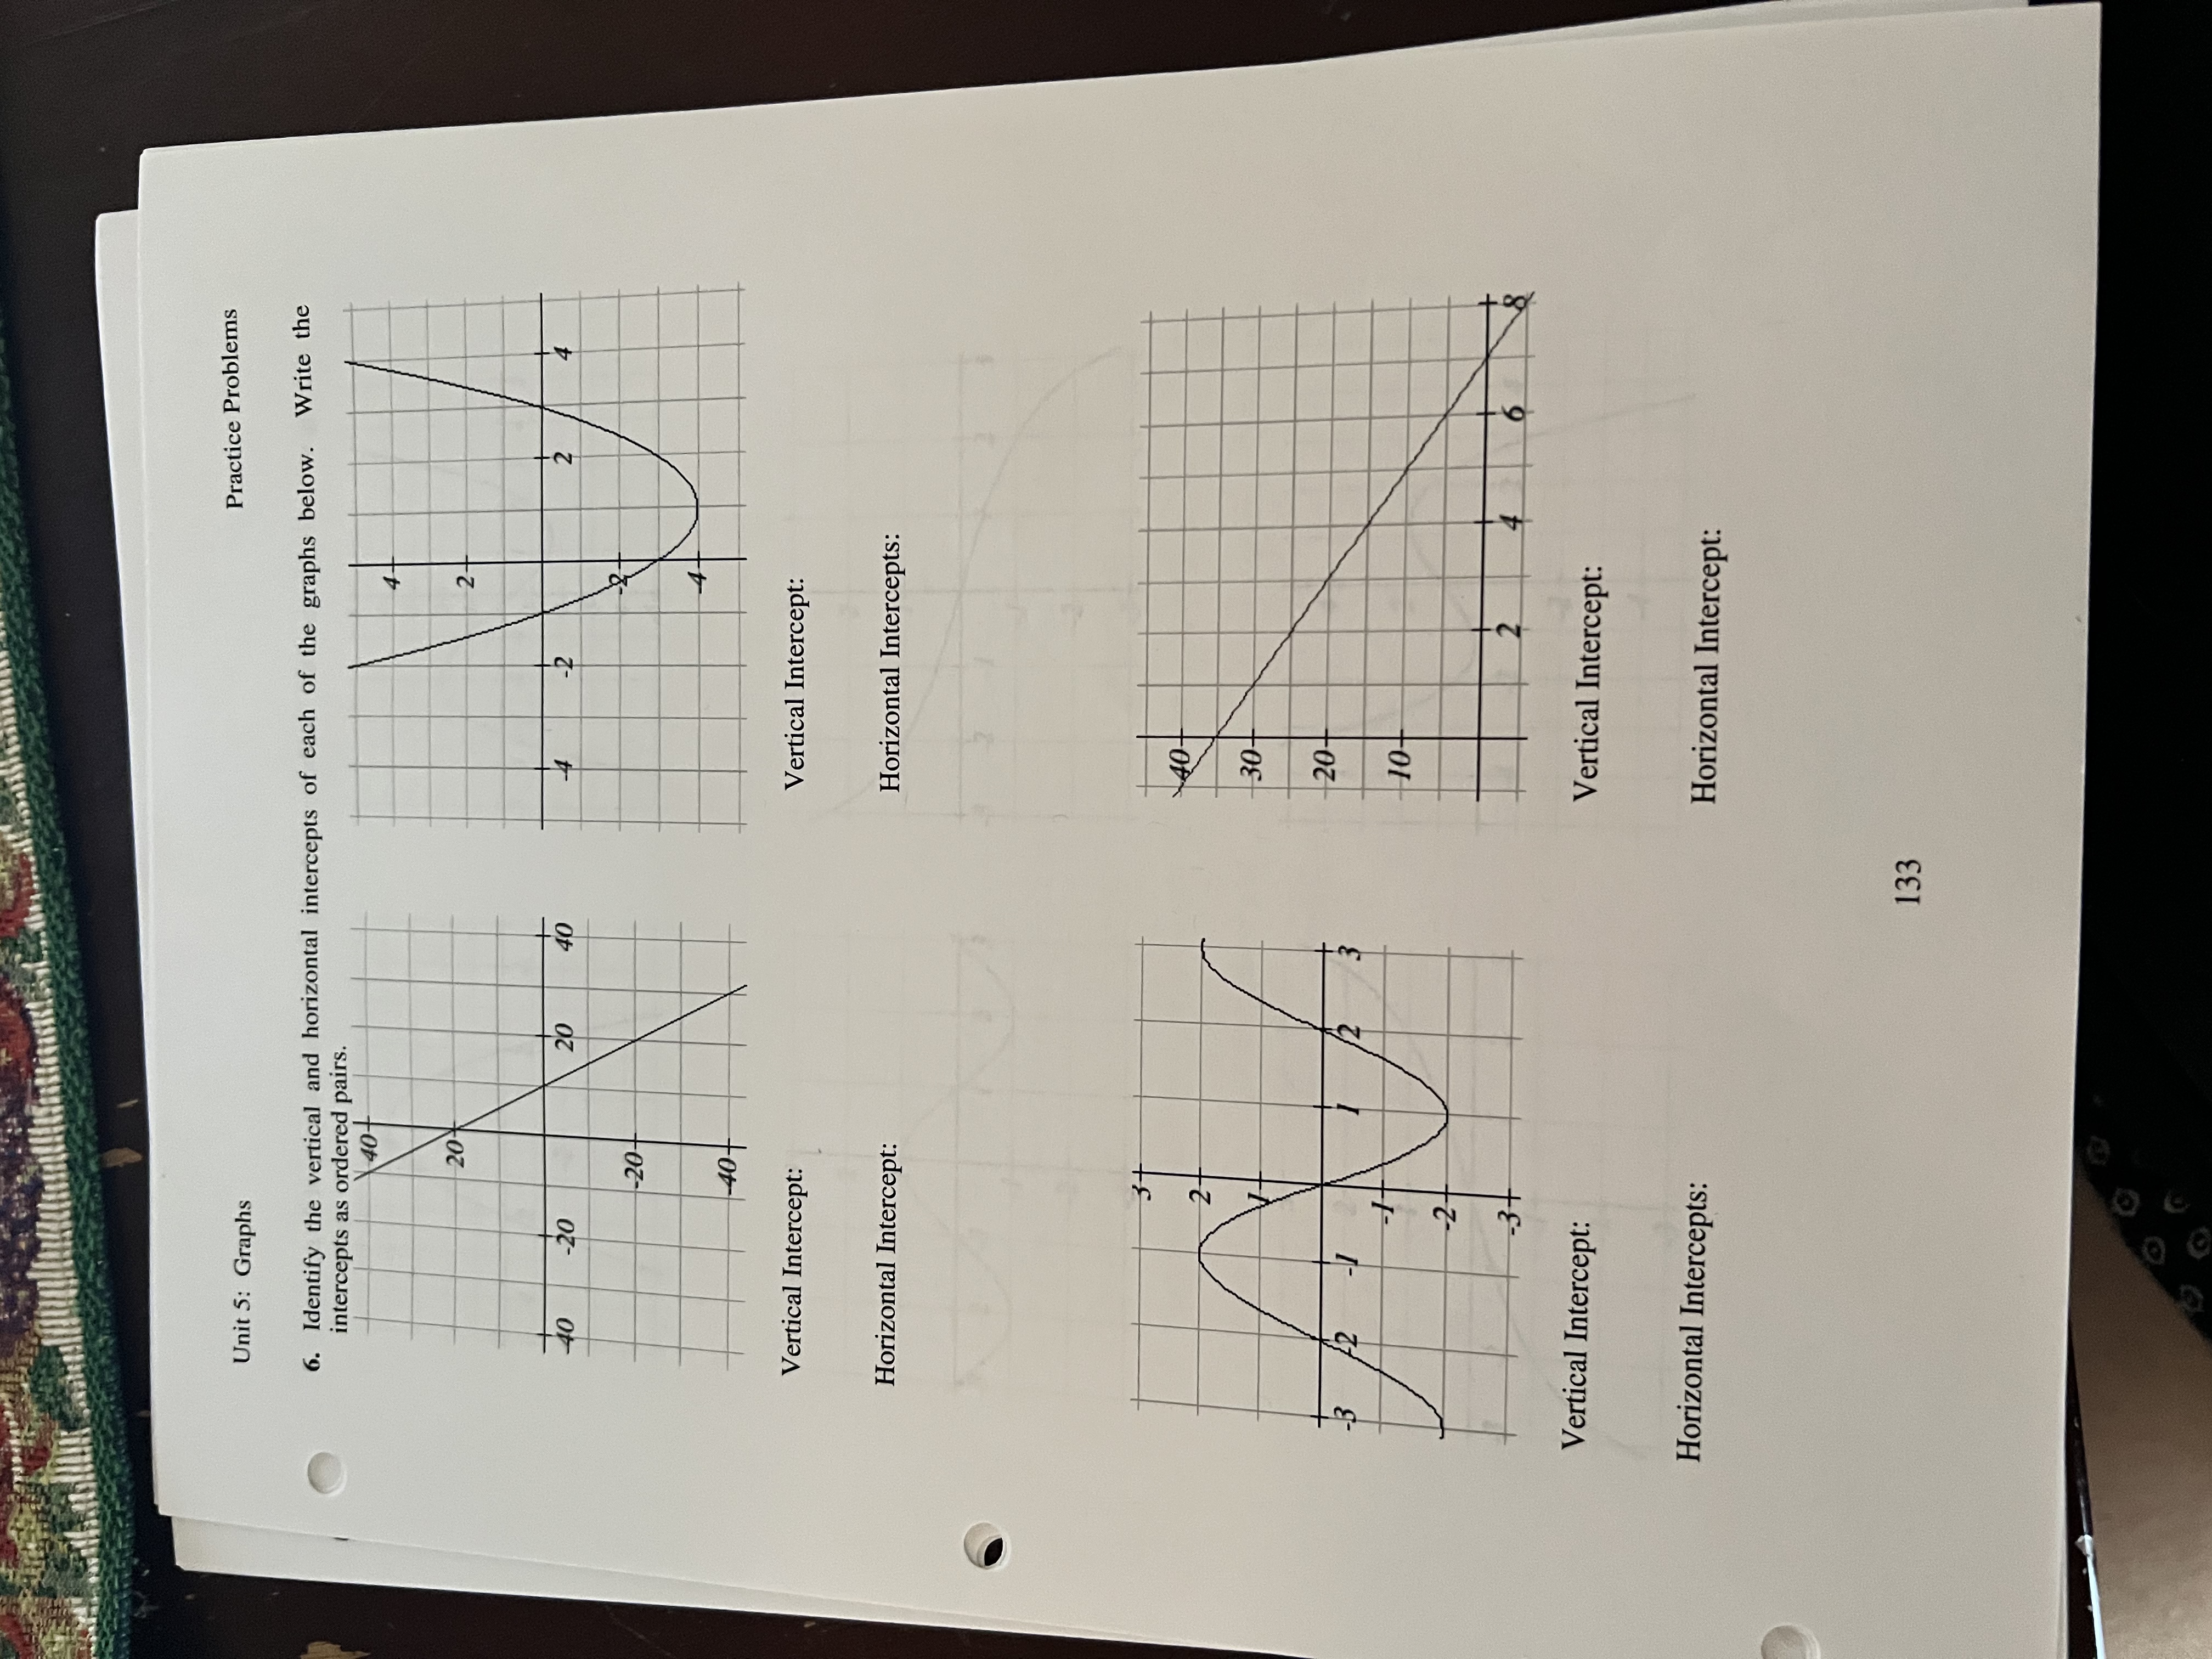
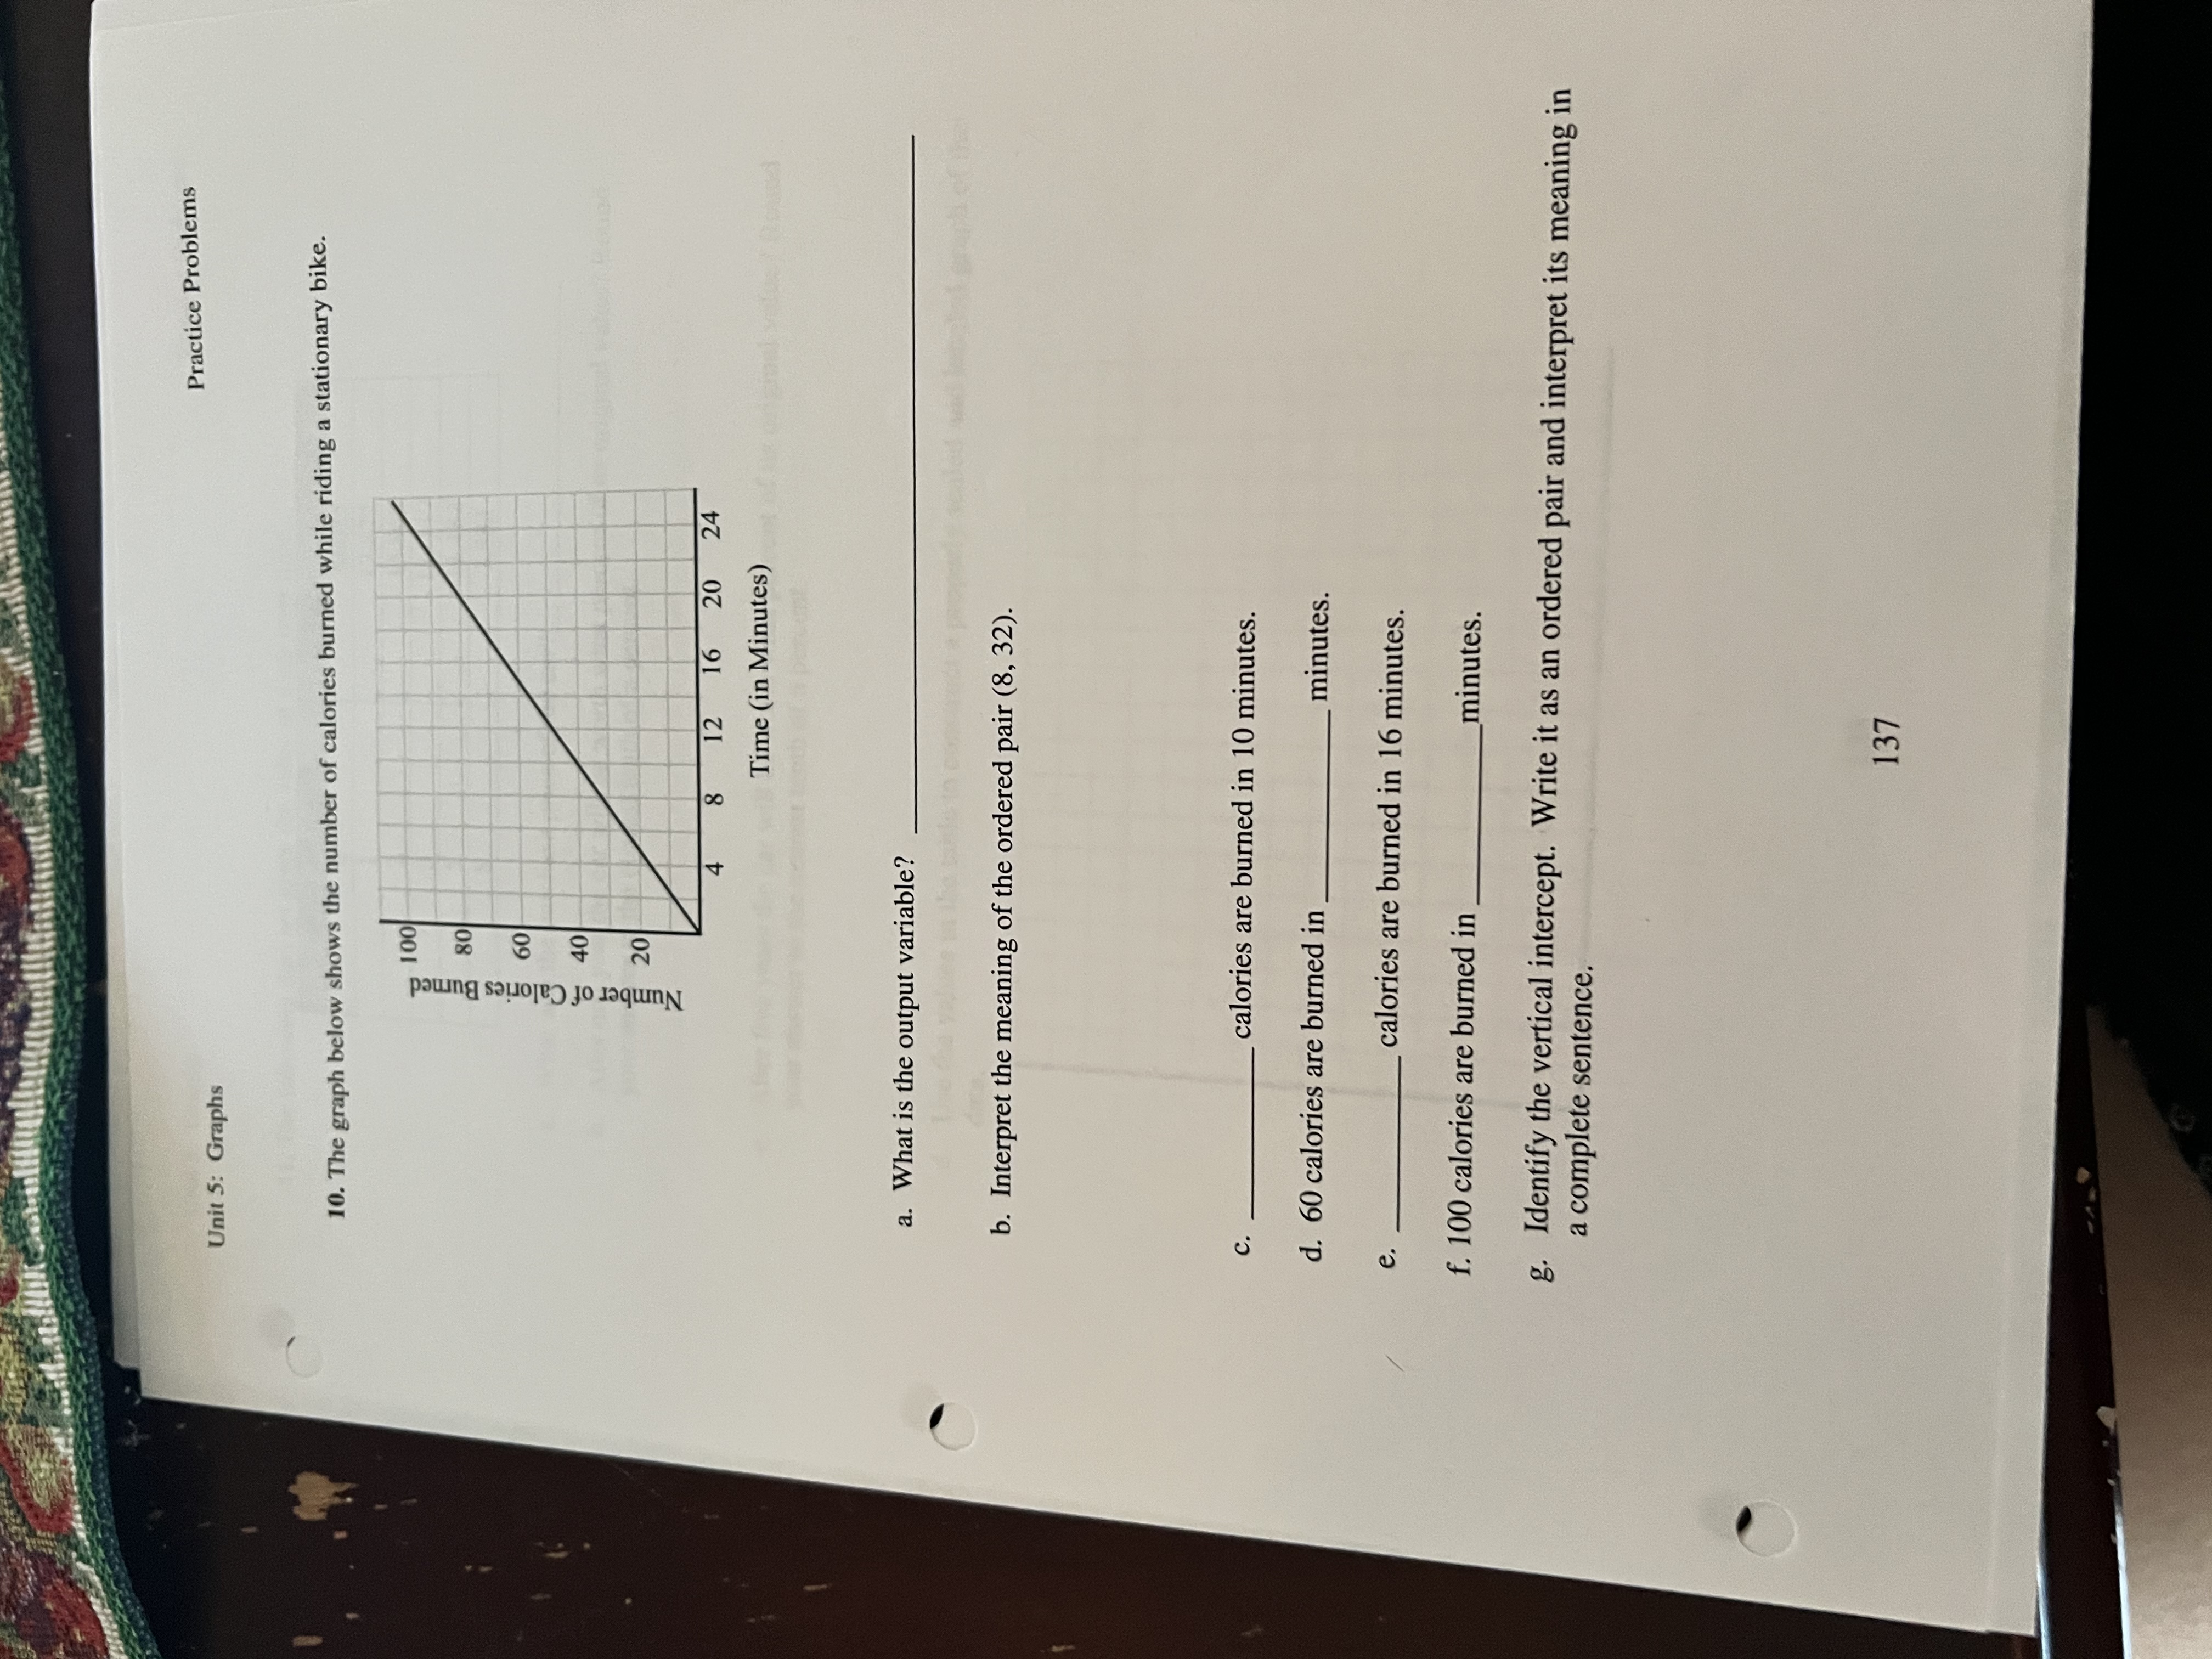
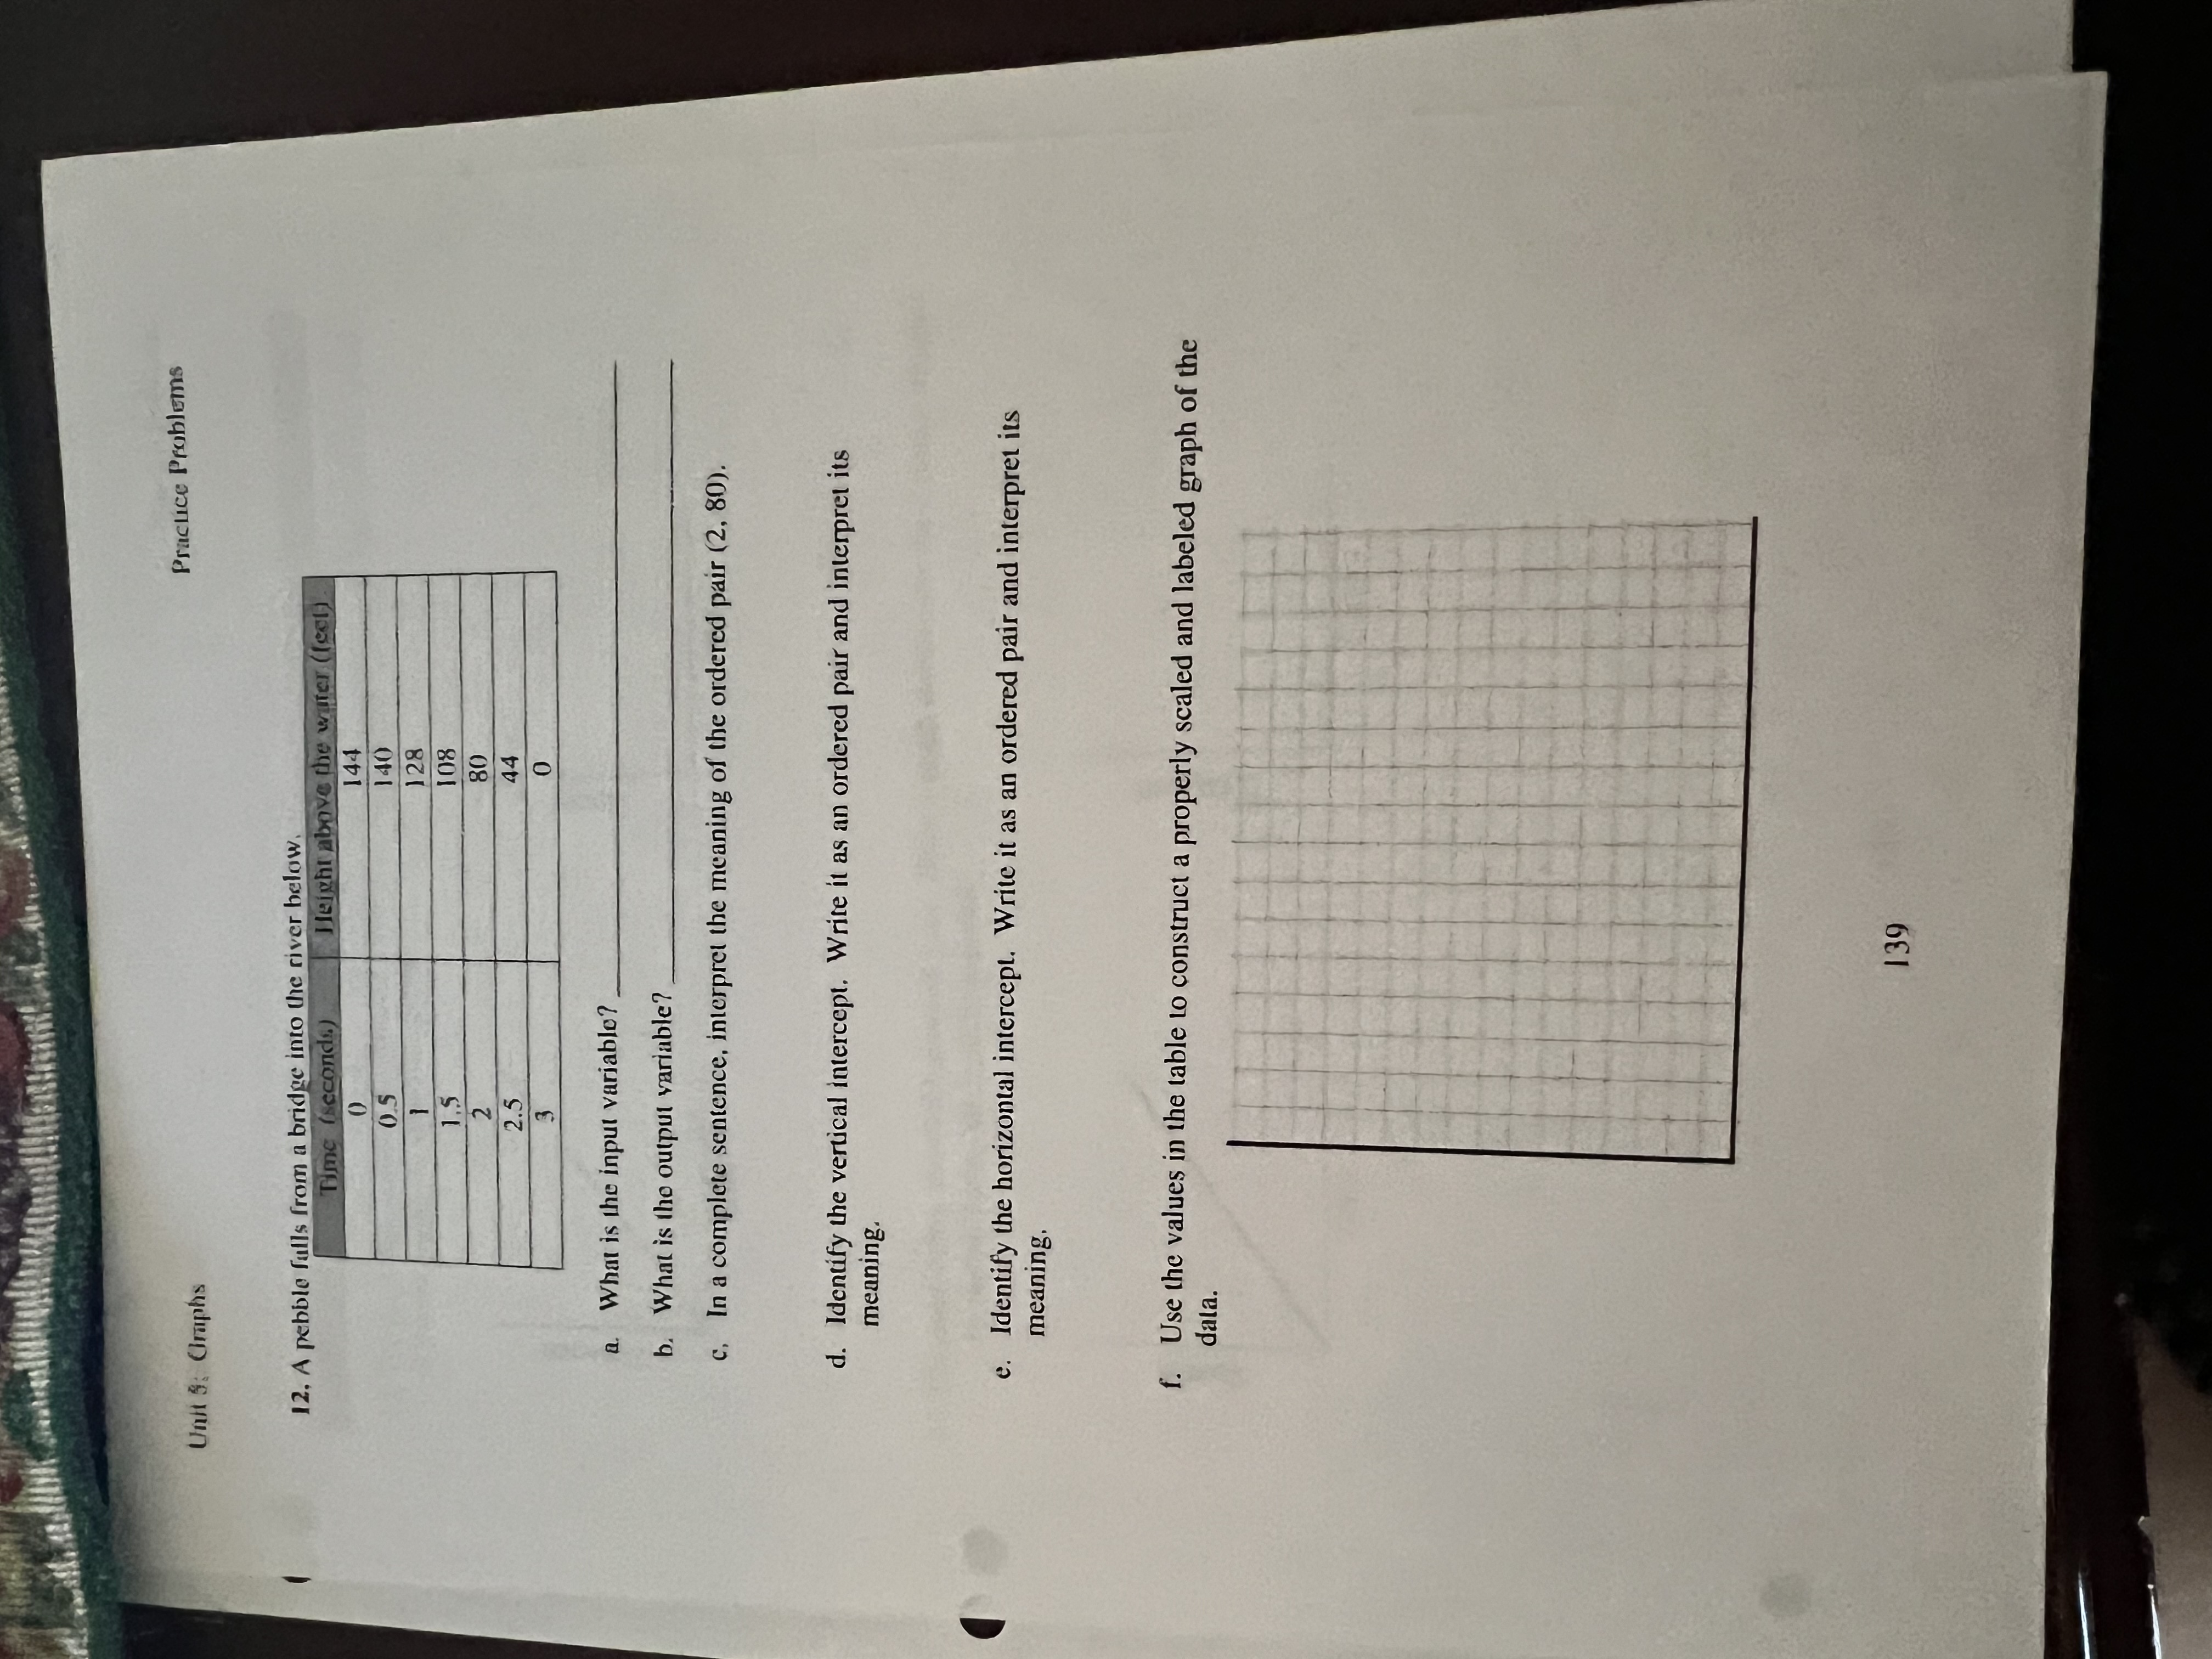
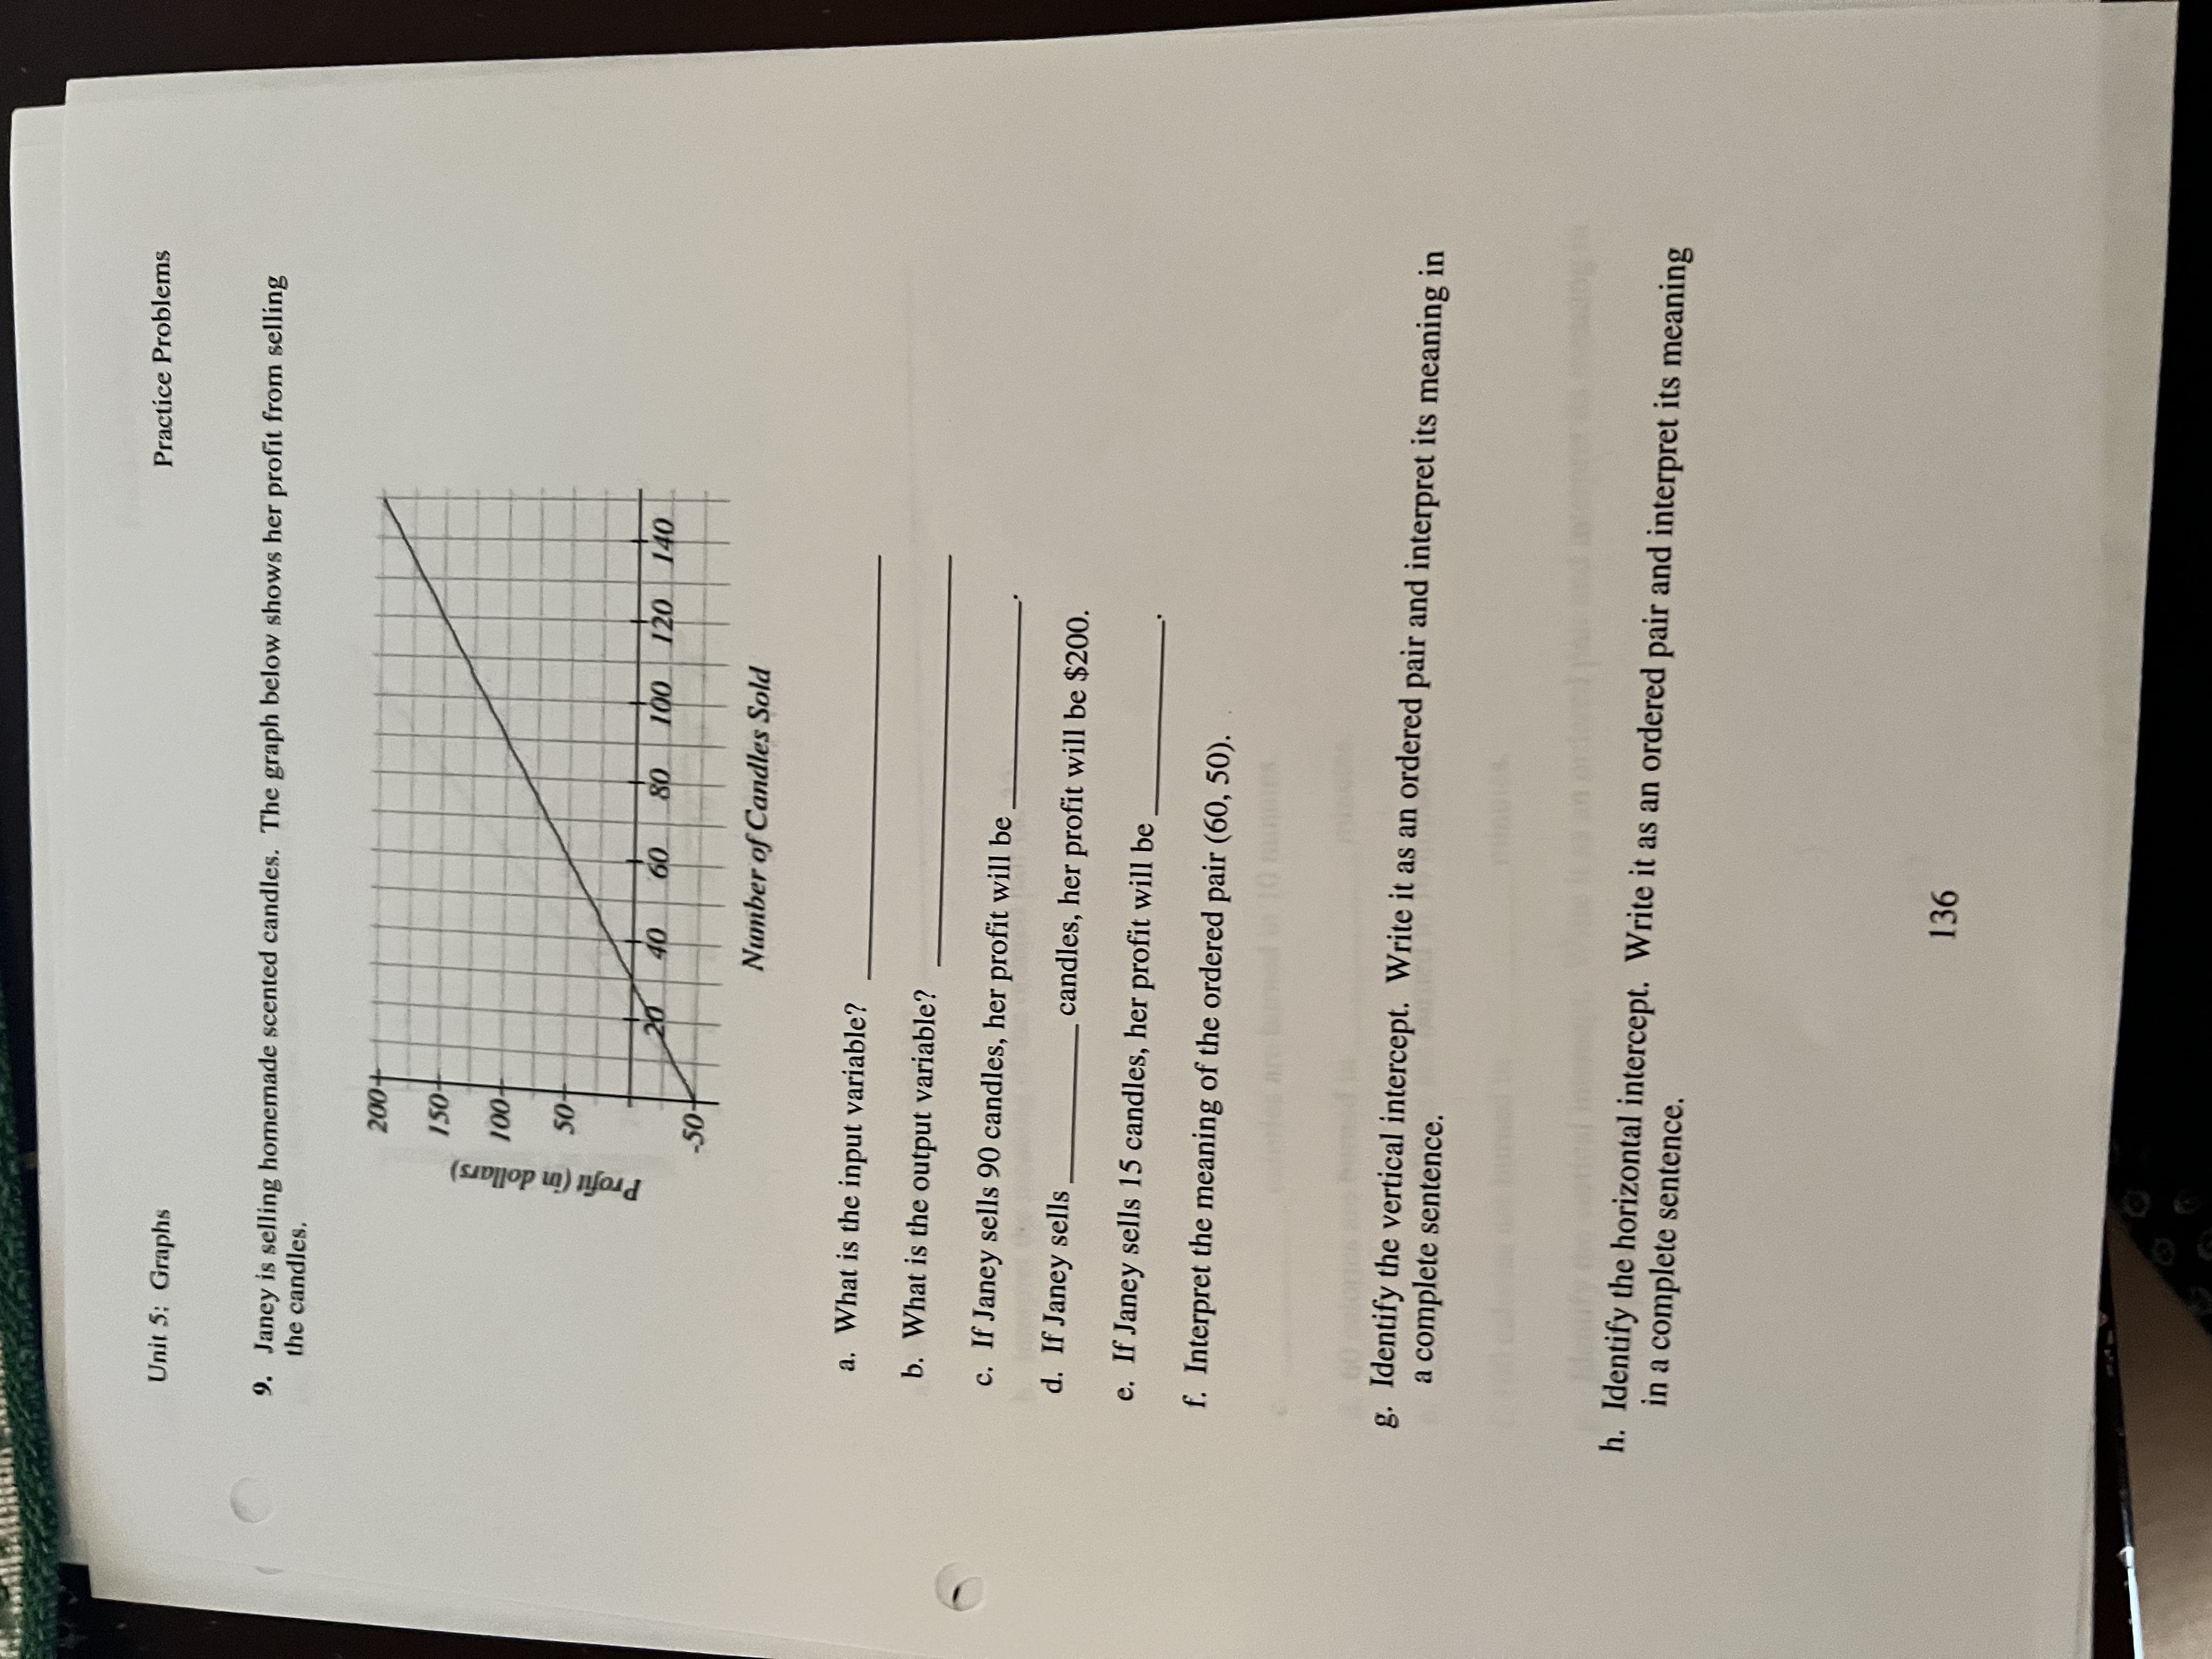
Practice Problems Unit 5: Graphs Applications 8. The graph below shows the population of a town over a 10-year time period. 16 Population (in thousands) N 10 Years Since 2004 a. What is the input variable? b. What is the output variable? d. The population of this town is (circle one) increasing decreasing e. The population of this town in the year 2006 was approximately f. The population of this town in the year 2011 was approximately g. The population of this town in the year was approximately 10,000 people. h. Interpret the meaning of the ordered pair (9, 12). i. Identify the vertical intercept. Write it as an ordered pair and interpret its meaning in a complete sentence. 135. Danblaine Date: Name: Unit 5: Practice Problems Skills Practice 1. Plot and label the points. -1 104 A. (8. 2) 18- B. (0, 0) C. (0, 5) 2+ D. (10, -10) 10 8- - 2 2 E. (-4, 4) F. (-9, - 1 ) G. (-5. 0) H. (2, -8) 2. Plot and label the points. A. (-800, 15) B. (650, 20) C. (100, 0) D. (0, -35) E. (-450, -40) F. (950, -30) Page 131Practice Problcima Unis 5: Carraptos 13. The graph below shows the distance traveled by a car, Draw a graph to represent the speed of the car during the same time period. Speed Distance Time Time 14. The graph below shows the speed of a car. Draw a graph to represent the distance traveled by the car during the same time period Speed Distance Time Time 140Practice Problems Unit 5: Graphs 3. Identify the graph that best represents the speed of a car coming to a stop at a red light. C. a. b. Speed Speed Speed Time Time Time 4. Identify the graph that best represents the height of an arrow that has been shot straight up in the air, and lands on the ground. a. b. C. Height Height Height Time Time Time 5. Identify the graph that best represents the distance traveled by a car driving at a constant speed. a. b. C. Distance Distance Distance Time Time Time 132\f\fUnit 5: Graphs Practice Problems 11. The following data set gives the value of a car over time Years since purchase Value in Dollars 0 20,025 17,822 15,862 14, 117 11,182 7,883 a. What was the purchase price of the car?_ b. After one year the car will be worth what percent of its original value? Round your answer to the nearest tenth of a percent c. After five years the car will be worth what percent of its original value? Round your answer to the nearest tenth of a percent. d. Use the values in the table to construct a properly scaled and labeled graph of the data 138Practice Problems Unit 5: Graphs 15. The graphs below shows Sara's distance from home over time. Describe the story that each graph tells about the Sara's journey. Graph Story Distance Time Distance ime Distance Time Distance Time Distance Time Distance Time Distance Time 1413. Consider the following data set. Years Since 1980 Sales (in millions of dollars) 0 3.2 5 2.4 10 1.5 15 1.3 21 1 .1 25 2.6 26 3.5 a. What is the input variable? b. What is the output variable? c. What were the sales in 1995? d. In a complete sentence, interpret the meaning of the ordered pair (0, 3.2). e. Use the values in the table to construct a properly scaled and labeled graph of the data. 144Unit 5: Graphs Practice Problems 6. Identify the vertical and horizontal intercepts of each of the graphs below. Write the intercepts as ordered pairs. 40- 4- 20- 2- 40 -20 20 40 - 2 2 -20+ 4- 40- Vertical Intercept: Vertical Intercept: Horizontal Intercept: Horizontal Intercepts: No 40- 30- 20- HO- N Vertical Intercept: Vertical Intercept: Horizontal Intercepts: Horizontal Intercept: 133 O\fPractice Problems Unit 5: Graphs 10. The graph below shows the number of calories burned while riding a stationary bike. 100 80 60 Number of Calories Burned 20 8 12 16 20 24 Time (in Minutes) a. What is the output variable? b. Interpret the meaning of the ordered pair (8, 32). C. calories are burned in 10 minutes. d. 60 calories are burned in minutes. e. calories are burned in 16 minutes. f. 100 calories are burned in minutes. g. Identify the vertical intercept. Write it as an ordered pair and interpret its meaning in a complete sentence. 137Unit S: Graphs Practice Problems 12, A pebble fulls from a bridge into the river below. Time (seconds) Height above the winter (feet) 0 144 O.S 140 128 108 80 2.5 44 0 a. What is the input variable? b. What is the output variable? C, In a complete sentence, interpret the meaning of the ordered pair (2, 80). d. Identify the vertical intercept. Write it as an ordered pair and interpret its meaning. e. Identify the horizontal intercept. Write it as an ordered pair and interpret its meaning. data. f. Use the values in the table to construct a properly scaled and labeled graph of the 139Practice Problems Unit 5: Graphs 9. Janey is selling homemade scented candles. The graph below shows her profit from selling the candles. 200+ 150- 100- Profit (in dollars) 50- 20 40 60 80 190 120 140 -50- Number of Candles Sold a. What is the input variable? b. What is the output variable? c. If Janey sells 90 candles, her profit will be d. If Janey sells candles, her profit will be $200. e. If Janey sells 15 candles, her profit will be f. Interpret the meaning of the ordered pair (60, 50). g. Identify the vertical intercept. Write it as an ordered pair and interpret its meaning in a complete sentence. h. Identify the horizontal intercept. Write it as an ordered pair and interpret its meaning in a complete sentence. 136
Step by Step Solution
There are 3 Steps involved in it
1 Expert Approved Answer
Step: 1 Unlock
Question Has Been Solved by an Expert!
Get step-by-step solutions from verified subject matter experts
Step: 2 Unlock
Step: 3 Unlock
Students Have Also Explored These Related Mathematics Questions!