

Question: Practice Question 7.2 A) The figure below shows the bid rent curves for land for use in housing (R), commercial purposes (Rc), and agricultural
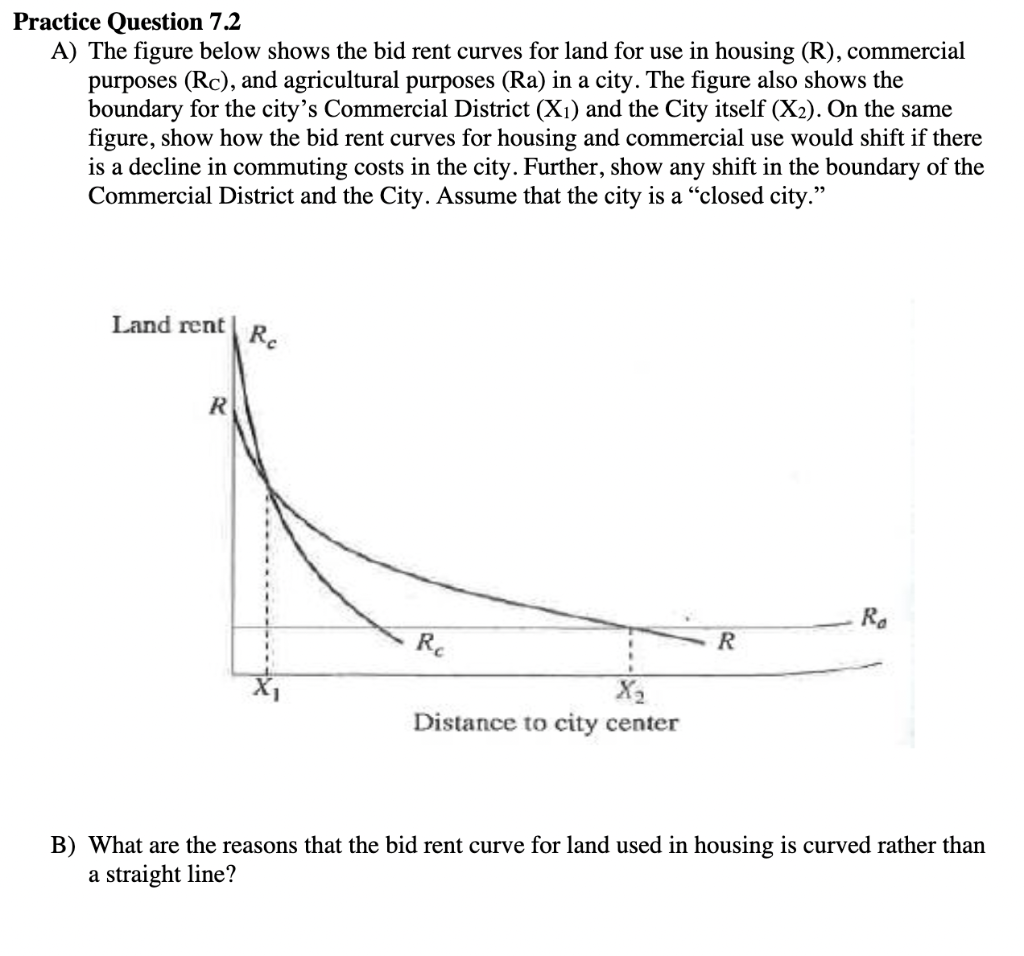
Practice Question 7.2 A) The figure below shows the bid rent curves for land for use in housing (R), commercial purposes (Rc), and agricultural purposes (Ra) in a city. The figure also shows the boundary for the city's Commercial District (X1) and the City itself (X2). On the same figure, show how the bid rent curves for housing and commercial use would shift if there is a decline in commuting costs in the city. Further, show any shift in the boundary of the Commercial District and the City. Assume that the city is a "closed city." Land rent R Re Re Distance to city center Ra R B) What are the reasons that the bid rent curve for land used in housing is curved rather than a straight line?
Step by Step Solution
There are 3 Steps involved in it

Get step-by-step solutions from verified subject matter experts