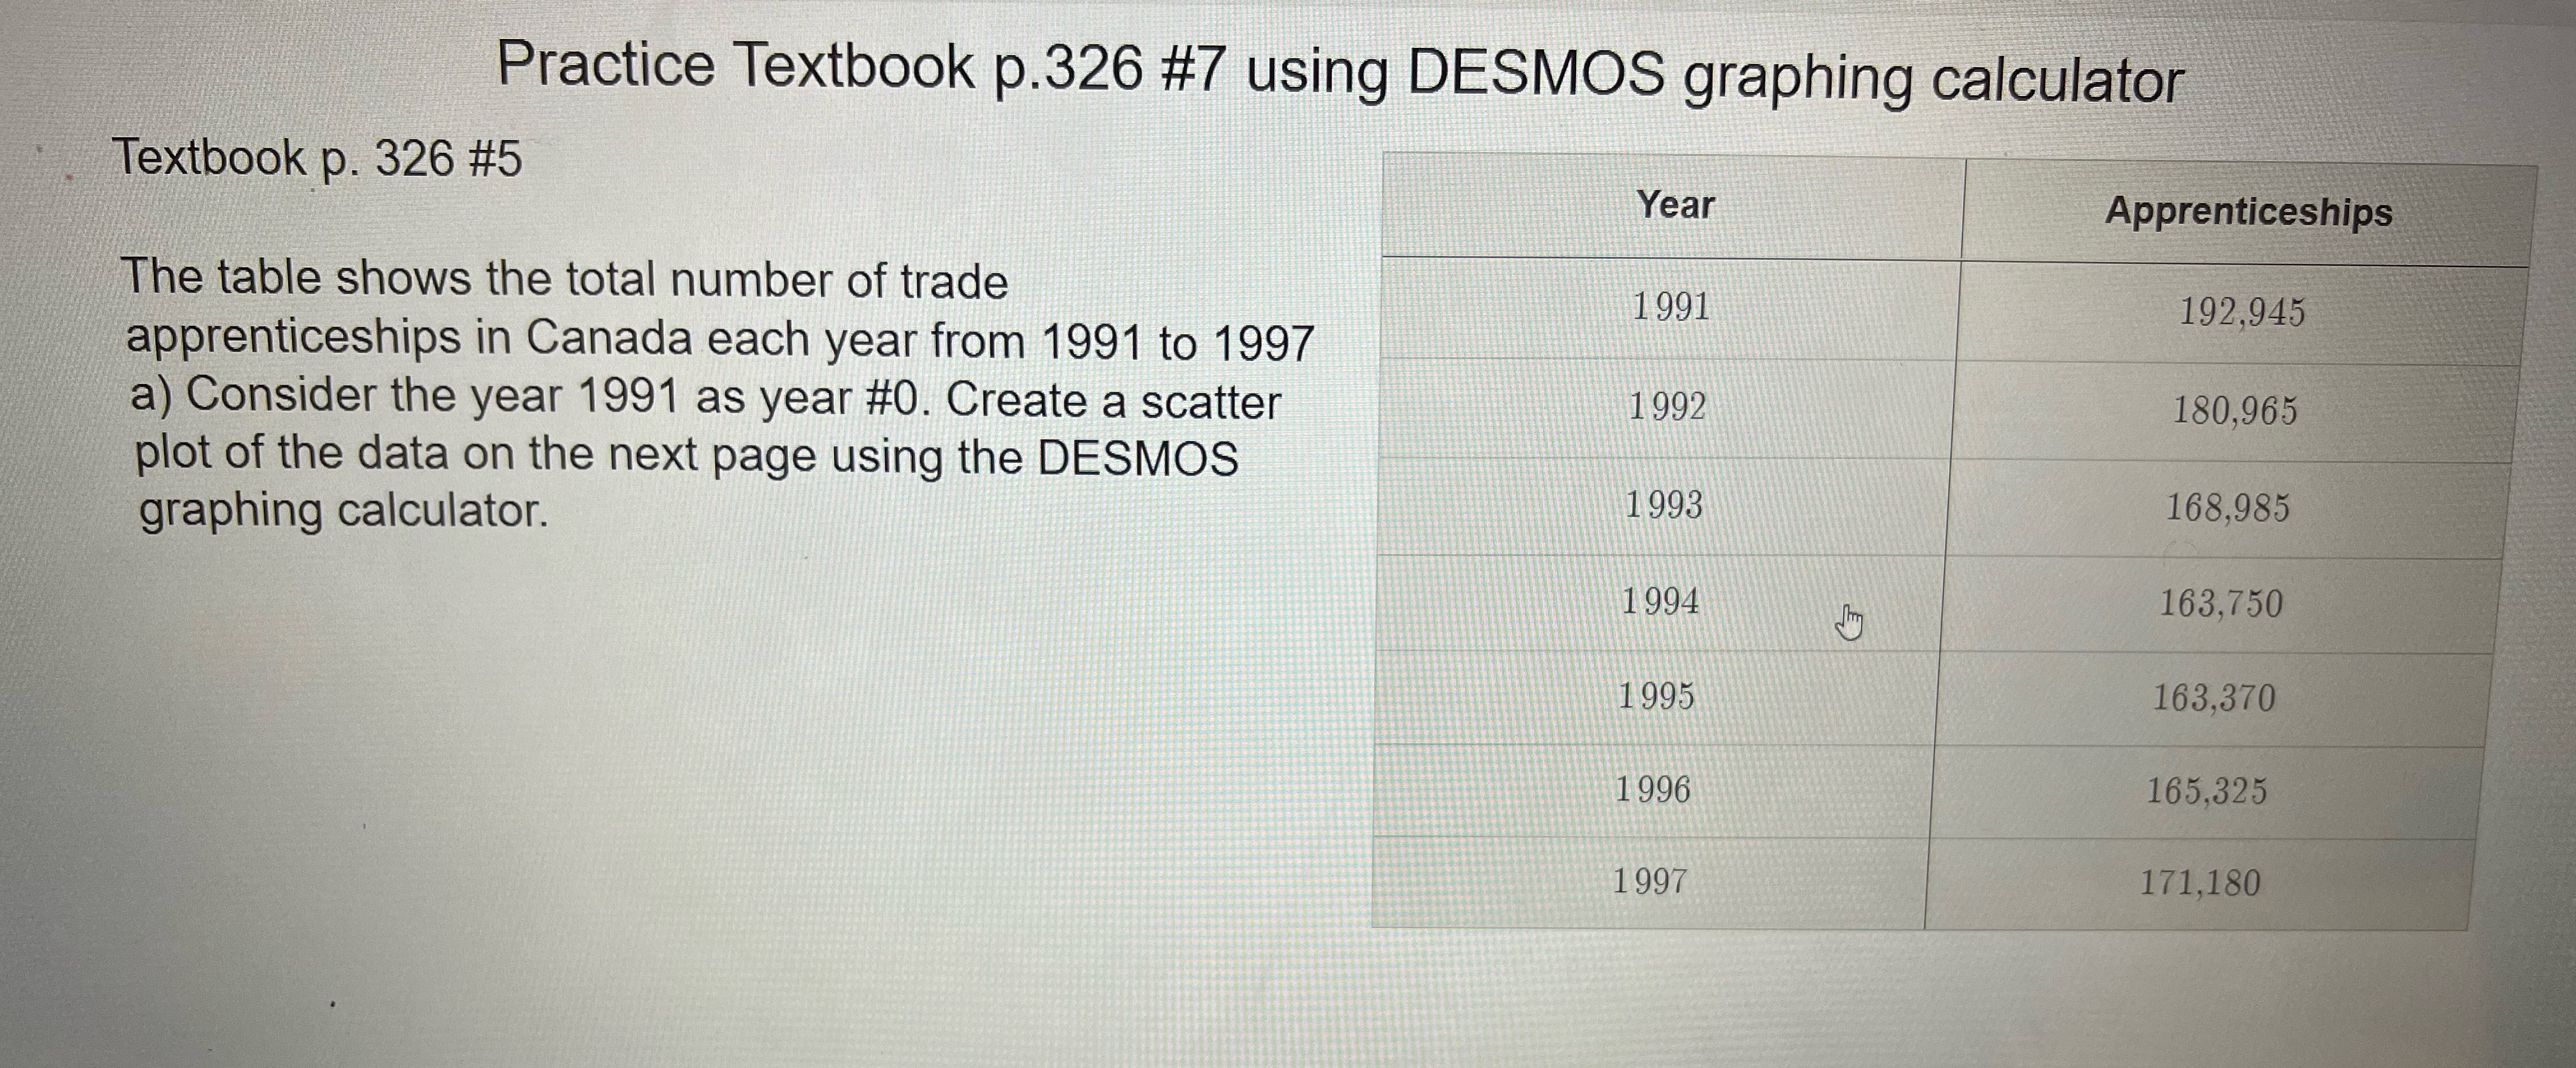
Question: Practice Textbook p.326 #7 using DESMOS graphing calculator Textbook p. 326 #5 Year Apprenticeships The table shows the total number of trade 1991 192,945 apprenticeships

Practice Textbook p.326 #7 using DESMOS graphingPractice Textbook p.326 #7 using DESMOS graphingPractice Textbook p.326 #7 using DESMOS graphing
Practice Textbook p.326 #7 using DESMOS graphing calculator Textbook p. 326 #5 Year Apprenticeships The table shows the total number of trade 1991 192,945 apprenticeships in Canada each year from 1991 to 1997 a) Consider the year 1991 as year #0. Create a scatter 1992 180,965 plot of the data on the next page using the DESMOS graphing calculator. 1993 168,985 1994 163,750 1995 163,370 1996 165,325 1997 171,180YouTube Maps News Translate ath Model PRACTICE using DESMOS - p.32... b) From the scatter plot, which model appears most appropriate: linear, quadratic, exponential. Give reason for your answer c) Generate a model for the data (line/curve of best fit) using regression. Write the equation of the model that best fits the data. search O N T CF 18'C Mostly cloudy ~ 9 6 6d) Use the model to predict when apprenticeships will return to 1991 levels. Submit O N T CE 18"C Mostly c

Step by Step Solution

There are 3 Steps involved in it

1 Expert Approved Answer
Step: 1 Unlock blur-text-image
Question Has Been Solved by an Expert!

Get step-by-step solutions from verified subject matter experts

Step: 2 Unlock
Step: 3 Unlock

Students Have Also Explored These Related Mathematics Questions!