Question: Pre-Assignment Instructions: To prepare you for this assignment, read the module 3 content, review all additional resources provided and complete the learning activity 3.1. Download

Pre-Assignment Instructions:

  1. To prepare you for this assignment, read the module 3 content, review all additional resources provided and complete the learning activity 3.1.
  2. Download the attached Excel file titled

Assignment Tasks:

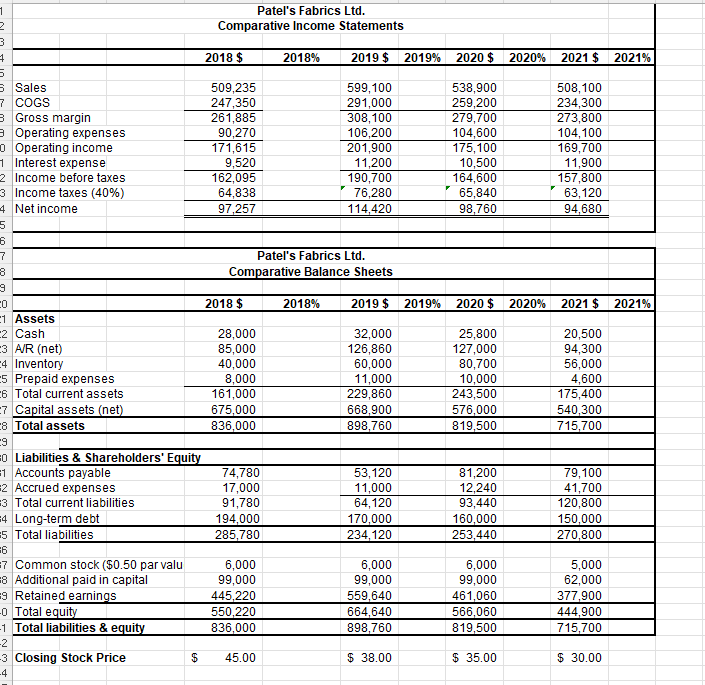
The tasks outlined below are to be completed based on the information provided in the attached excel file.

  • Perform a Horizontal analysis for the year 2018 to year 2021 Income Statement and Balance sheet.
  • Perform a Vertical analysis (common size statements) for the year 2018 to year 2021 Income Statement and Balance sheet.
    • Always consider the first year as the base year for the horizontal analysis.
  • Provide your observations on the trends of the business, based on your horizontal and vertical analysis.
  • Assess the business' liquidity by using liquidity ratios.
    • Is the company's position improving or deteriorating? Explain your answer.
  • Assess the business' profitability by using profitability ratios.
    • Is the company's position improving or deteriorating? Explain your answer.
  • Based on the above analysis (horizontal, vertical, and ratios), write a brief financial summary of the business, and explain any observed risks/weaknesses for the business.
Pre-Assignment Instructions: To prepare you for
Patel's Fabrics Ltd. Comparative Income Statements 2018 $ 2018% 2019 $ 2019% 2020 $ 2020% 2021 $ 2021% Sales 509,235 599,100 538,900 508, 100 COGS 247,350 291,000 259,200 234,300 Gross margin 261,885 308, 100 279,700 273,800 Operating expenses 90,270 106,200 104,600 104,100 Operating income 171,615 201,900 175,100 169,700 Interest expense 9,520 11,200 10,500 11,900 Income before taxes 162,095 190,700 164,600 157,800 Income taxes (40%) 64,838 76,280 65.840 63,120 Net income 97,257 114,420 98,760 94,680 Patel's Fabrics Ltd. Comparative Balance Sheets 2018 $ 2018% 2019 $ 2019% 2020 $ 2020% 2021 $ 2021% Assets 2 Cash 28,000 32,000 25,800 20,500 AR (net) 85.000 126,860 127,000 94,300 Inventory 40,000 60,000 80,700 56,000 Prepaid expenses 8 000 1.000 10.000 4 600 Total current assets 161,000 229,860 243,500 175,400 Capital assets (net) 675,000 668,900 576,000 540,300 8 Total assets 836,000 898,760 819,500 715,700 1 Liabilities & Shareholders' Equity Accounts payable 74,780 53,120 81,200 79,100 2 Accrued expenses 17,000 11,000 12,240 41,700 13 Total current liabilities 91,780 64,120 93,440 120,800 Long-term debt 194,000 170,000 160,000 150,000 15 Total liabilities 285,780 234,120 253,440 270,800 Common stock ($0.50 par valu 6,000 6,000 6,000 5,000 Additional paid in capital 99,000 99,000 99,000 62,000 19 Retained earnings 445,220 559,640 461,060 377,900 Total equity 650,220 664,640 566,060 444,900 Total liabilities & equity 836,000 898,760 819,500 715,700 Closing Stock Price $ 45.00 $ 38.00 $ 35.00 $ 30.00

Step by Step Solution

There are 3 Steps involved in it

1 Expert Approved Answer
Step: 1 Unlock blur-text-image
Question Has Been Solved by an Expert!

Get step-by-step solutions from verified subject matter experts

Step: 2 Unlock
Step: 3 Unlock

Students Have Also Explored These Related Accounting Questions!