

Question: PreCalculus Algebra Name Systems Application Assignment Data collected by the US Census Bureau shows that fewer US adults are getting married Answer the questions below.
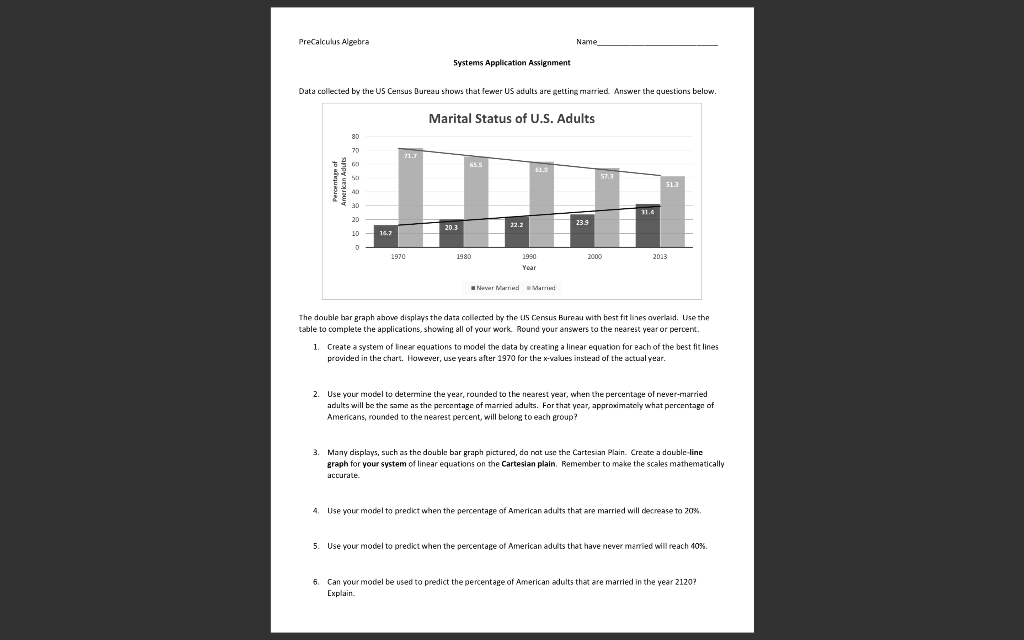
PreCalculus Algebra Name Systems Application Assignment Data collected by the US Census Bureau shows that fewer US adults are getting married Answer the questions below. Marital Status of U.S. Adults 80 70 21.7 66 65.5 61.3 Amerkan Adults 50 40 30 20 203 23.9 22.2 10 16.7 1970 1980 2000 2013 1990 Year Never Married Married The double har graph above displays the data collected by the US Census Bureau with best fit lines averiaid. Use the table to complete the applications, showing all of your work. Round your answers to the nearest year or percent. 1. Create a system of linear equations to model the data by creating a linear equation for each of the best fit lines provided in the chart. However, use years after 1970 for the x-values instead of the actual year. 2. Use your model to determine the year, rounded to the nearest year, when the percentage of never-married adults will be the same as the percentage of married adults. For that year, approximately what percentage of Americans, rounded to the nearest percent, will belong to each group? 3. Many displays, such as the double bar graph pictured, da nat use the Cartesian Plain. Create a double-line graph for your system of linear equations on the Cartesian plain. Remember to make the scales mathematically accurate 4. Use your model to predict when the percentage of American adults that are married will decrease to 20%. 5. Use your model to predict when the percentage of American adults that have never married will reach 40% 6. Can your model be used to predict the percentage of American adults that are married in the year 2120? ? Explain PreCalculus Algebra Name Systems Application Assignment Data collected by the US Census Bureau shows that fewer US adults are getting married Answer the questions below. Marital Status of U.S. Adults 80 70 21.7 66 65.5 61.3 Amerkan Adults 50 40 30 20 203 23.9 22.2 10 16.7 1970 1980 2000 2013 1990 Year Never Married Married The double har graph above displays the data collected by the US Census Bureau with best fit lines averiaid. Use the table to complete the applications, showing all of your work. Round your answers to the nearest year or percent. 1. Create a system of linear equations to model the data by creating a linear equation for each of the best fit lines provided in the chart. However, use years after 1970 for the x-values instead of the actual year. 2. Use your model to determine the year, rounded to the nearest year, when the percentage of never-married adults will be the same as the percentage of married adults. For that year, approximately what percentage of Americans, rounded to the nearest percent, will belong to each group? 3. Many displays, such as the double bar graph pictured, da nat use the Cartesian Plain. Create a double-line graph for your system of linear equations on the Cartesian plain. Remember to make the scales mathematically accurate 4. Use your model to predict when the percentage of American adults that are married will decrease to 20%. 5. Use your model to predict when the percentage of American adults that have never married will reach 40% 6. Can your model be used to predict the percentage of American adults that are married in the year 2120? ? Explain
Step by Step Solution
There are 3 Steps involved in it

Get step-by-step solutions from verified subject matter experts