

Question: Precision Tool 2011 and 2012 Balance Sheets 2011 2012 2011 2012 Cash S2,060 $1,003 $7.250 58.384 Accounts rec. 3,411 4.218 9,800 11,500 Accounts payable Long-term
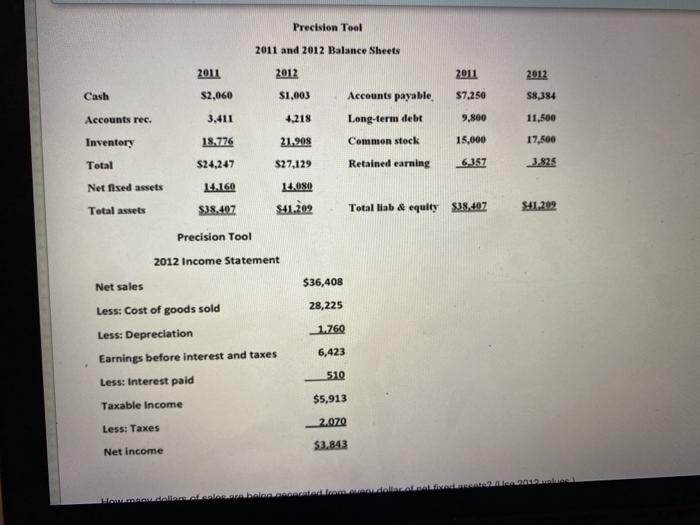
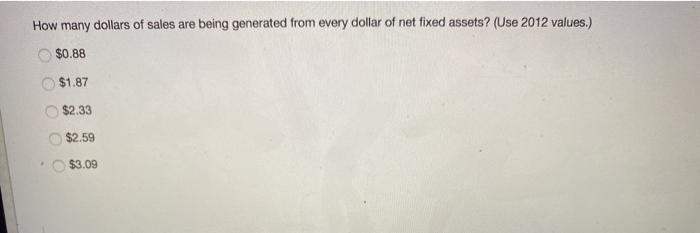
Precision Tool 2011 and 2012 Balance Sheets 2011 2012 2011 2012 Cash S2,060 $1,003 $7.250 58.384 Accounts rec. 3,411 4.218 9,800 11,500 Accounts payable Long-term debt Common stock Retained earning Inventory 18.276 21.908 17,500 15,000 6357 Total $24.247 $27,129 3.825 14.160 Net fixed assets Total assets 14.080 $41.302 $38.407 Total lab & equity $28,407 $41.202 Precision Tool 2012 Income Statement $36,408 28,225 Net sales Less: Cost of goods sold Less: Depreciation Earnings before interest and taxes 1.760 6,423 510 Less: Interest paid $5,913 Taxable income Less: Taxes 2.070 $3.843 Net Income Volt Howardollarial mlar How many dollars of sales are being generated from every dollar of net fixed assets? (Use 2012 values.) $0.88 $1.87 $2.33 $2.59 $3.09
Step by Step Solution
There are 3 Steps involved in it

Get step-by-step solutions from verified subject matter experts