

Question: Predicted Temp= 43 + 0.9(chip rate) c) What is the predicted temperature if the snowy tree cricket is chirping at a rate of 60 chirps
Predicted Temp= 43 + 0.9(chip rate)
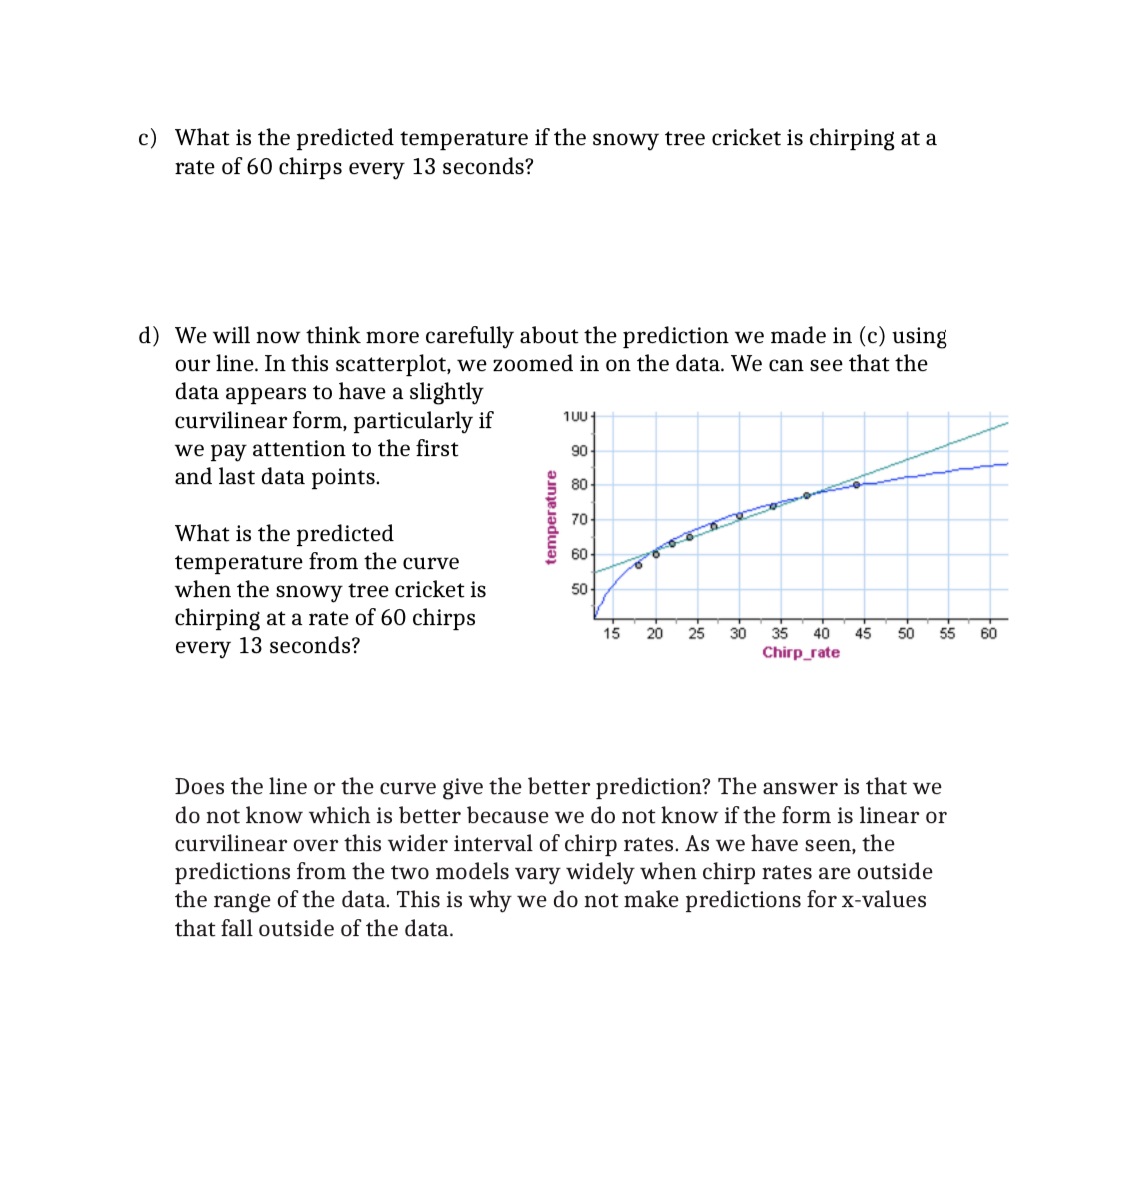
c) What is the predicted temperature if the snowy tree cricket is chirping at a rate of 60 chirps every 13 seconds? d) We will now think more carefully about the prediction we made in (c) using our line. In this scatterplot, we zoomed in on the data. We can see that the data appears to have a slightly curvilinear form, particularly if 1\"" we pay attention to the rst so and last data points. '5' an '5 . . E 70 What 1s the predicted 5 temperature from the curve ~ 6 when the snowy tree cricket is 50 chirping at a rate of 60 chirps 1s 20 25 an 35 m '5 so 55 so every 13 seconds? Chirp_rto Does the line or the curve give the better prediction? The answer is that we do not know which is better because we do not know if the form is linear or curvilinear over this wider interval of chirp rates. As we have seen, the predictions from the two models vary widely when chirp rates are outside the range of the data. This is why we do not make predictions for x-values that fall outside of the data
Step by Step Solution
There are 3 Steps involved in it

Get step-by-step solutions from verified subject matter experts