

Question: Predicting Software Reselling Profits. Taiko Software is a software catalog firm that sells games and educational software. It started out as a software manufacturer and
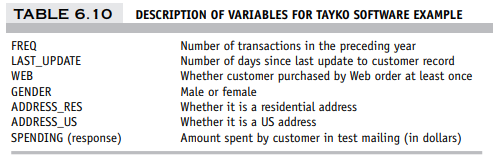
Predicting Software Reselling Profits. Taiko Software is a software catalog firm that sells games and educational software. It started out as a software manufacturer and then added third-party titles to its offerings. It recently revised its collection of items in a new catalog, which it mailed out to its customers. This mailing yielded 2000 purchases. Based on these data, Tayko wants to devise a model for predicting the spending amount that a purchasing customer will yield. The file Tayko.csv contains information on 2000 purchases. Table 6.10 describes the variables to be used in the problem (the Excel file contains additional variables).
a. Explore the spending amount by creating a pivot table for the categorical variables and computing the average and standard deviation of spending in each category.
b. Explore the relationship between spending and each of the two continuous predictors by creating two scatterplots (Spending vs. Freq, and Spending vs. last update days ago. Does there seem to be a linear relationship?
c. To fit a predictive model for Spending:
i. Partition the 2000 records into training and validation sets.
ii. Run a multiple linear regression model for Spending vs. all six predictors. Give the estimated predictive equation.
iii. Based on this model, what type of purchaser is most likely to spend a large amount of money?
iv. If we used backward elimination to reduce the number of predictors, which predictor would be dropped first from the model?
v. Show how the prediction and the prediction error are computed for the first purchase in the validation set.
vi. Evaluate the predictive accuracy of the model by examining its performance on the validation set.
vii. Create a histogram of the model residuals. Do they appear to follow a normal distribution? How does this affect the predictive performance of the model?
TABLE 6.10 FREQ LAST UPDATE WEB GENDER ADDRESS_RES ADDRESS_US SPENDING (response) DESCRIPTION OF VARIABLES FOR TAYKO SOFTWARE EXAMPLE Number of transactions in the preceding year Number of days since last update to customer record Whether customer purchased by Web order at least once Male or female Whether it is a residential address Whether it is a US address Amount spent by customer in test mailing (in dollars)
Step by Step Solution
3.48 Rating (171 Votes )
There are 3 Steps involved in it
To approach this problem Ill guide you through each step a Pivot Table for Categorical Variables To explore the spending amount 1 Import the Data Use ... View full answer

Get step-by-step solutions from verified subject matter experts