

Question: Prediction Errors The scatter plot below depicts the ages of the fathers (X) and mothers (Y) of the 712 students who responded to Bonus Survey
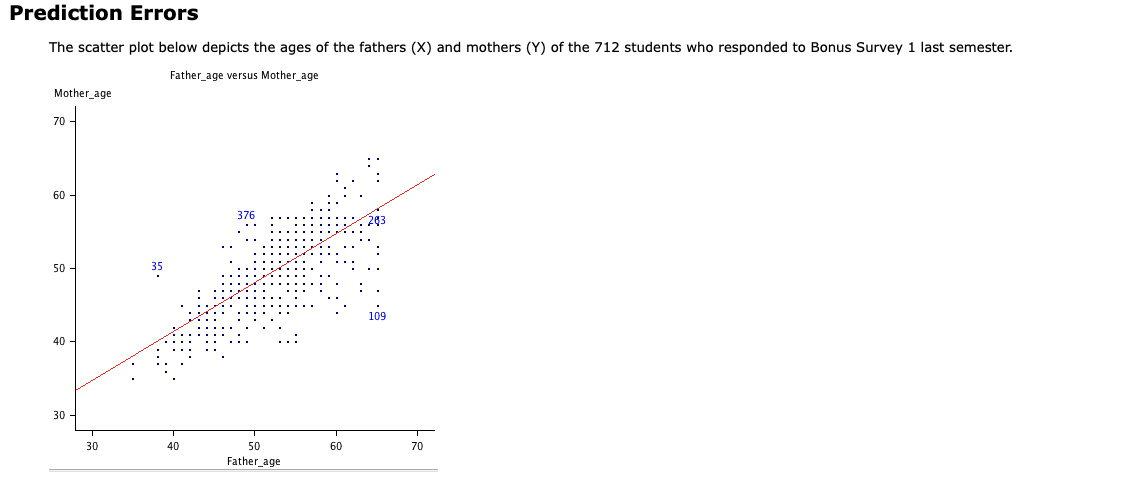
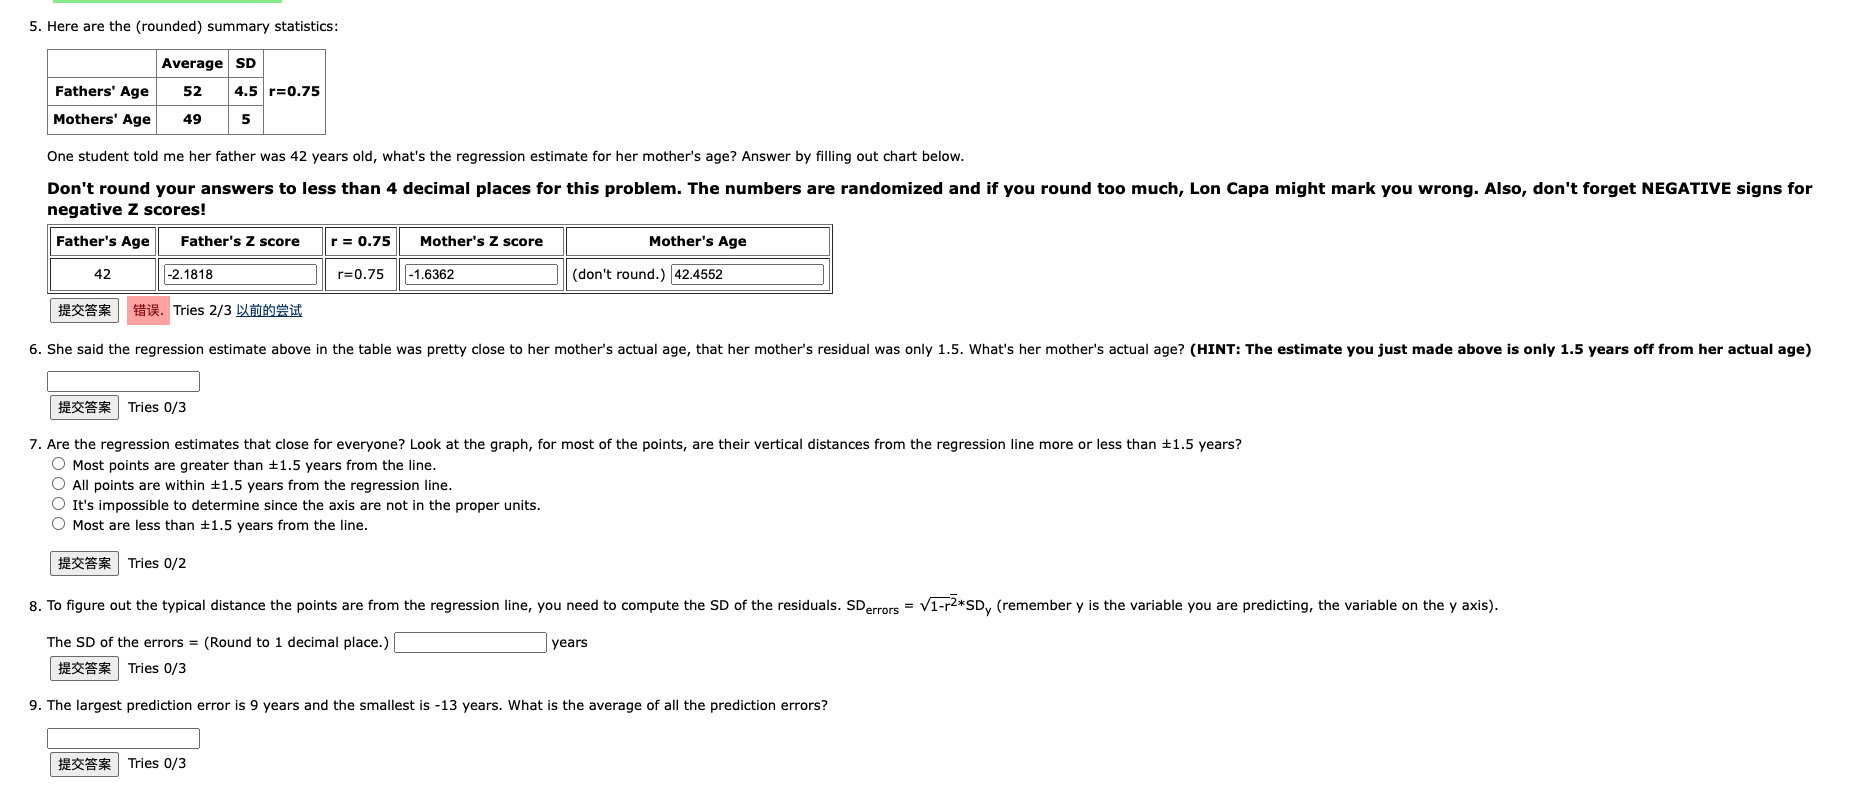
Prediction Errors The scatter plot below depicts the ages of the fathers (X) and mothers (Y) of the 712 students who responded to Bonus Survey 1 last semester. Father_age versus Mother_age Mother_age 70 - 60 376 263 50 35 109 40 30 - 30 40 50 60 70 Father_age5. Here are the (rounded) summary statistics: Average SD Fathers' Age 52 4.5 r=0.75 Mothers' Age 49 5 One student told me her father was 42 years old, what's the regression estimate for her mother's age? Answer by filling out chart below. Don't round your answers to less than 4 decimal places for this problem. The numbers are randomized and if you round too much, Lon Capa might mark you wrong. Also, don't forget NEGATIVE signs for negative Z scores! Father's Age Father's Z score r = 0.75 Mother's Z score Mother's Age 42 -2. 1818 r=0.75 -1.6362 (don't round.) 42.4552 HiR. Tries 2/3 LXBomb=it 6. She said the regression estimate above in the table was pretty close to her mother's actual age, that her mother's residual was only 1.5. What's her mother's actual age? (HINT: The estimate you just made above is only 1.5 years off from her actual age) HAS Tries 0/3 7. Are the regression estimates that close for everyone? Look at the graph, for most of the points, are their vertical distances from the regression line more or less than #1.5 years? Most points are greater than +1.5 years from the line. All points are within +1.5 years from the regression line. It's impossible to determine since the axis are not in the proper units. O Most are less than +1.5 years from the line. HAS Tries 0/2 8. To figure out the typical distance the points are from the regression line, you need to compute the SD of the residuals. SDerrors = V1-r2*SDy (remember y is the variable you are predicting, the variable on the y axis). The SD of the errors = (Round to 1 decimal place.) years HX- Tries 0/3 9. The largest prediction error is 9 years and the smallest is -13 years. What is the average of all the prediction errors? RX= Tries 0/3
Step by Step Solution
There are 3 Steps involved in it

Get step-by-step solutions from verified subject matter experts