

Question: Predictive Analysis This is a team project. Please upload only one report per team in the link that is provided at the end of week
Predictive Analysis This is a team project. Please upload only one report per team in the link that is provided at the end of week 7.
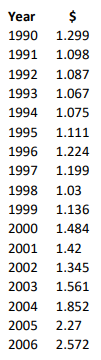
You can upload either an Excel or pdf file on the link. The following data shows the gas prices from 1990 to 2006. Forecast the gas price from 2007-2009 using the following forecasting techniques:
1. Nave
2. MA5
3. Exponential smoothing w=.6 (optimize using Solver)
4. Holts method with w = .5 and v = .5 (optimize using Solver) only do this first, forecast from 2007 to 2009
5. Use MAPE for the measure of the reliability of your forecasting method and use the best method to forecast the gas price in 2007.
Please mainly answer the 4th question which is highlighted in bold.
i.e 4. Holts method with w = .5 and v = .5 (optimize using Solver) Please answer this question first
using this method show the forecast the gas price from 2007-2009.
After which, if you feel like it`s easy to complete whole answer please go ahead and post it.
Thank you.
\begin{tabular}{ll} Year & \multicolumn{1}{c}{$} \\ 1990 & 1.299 \\ 1991 & 1.098 \\ 1992 & 1.087 \\ 1993 & 1.067 \\ 1994 & 1.075 \\ 1995 & 1.111 \\ 1996 & 1.224 \\ 1997 & 1.199 \\ 1998 & 1.03 \\ 1999 & 1.136 \\ 2000 & 1.484 \\ 2001 & 1.42 \\ 2002 & 1.345 \\ 2003 & 1.561 \\ 2004 & 1.852 \\ 2005 & 2.27 \\ 2006 & 2.572 \end{tabular} \begin{tabular}{ll} Year & \multicolumn{1}{c}{$} \\ 1990 & 1.299 \\ 1991 & 1.098 \\ 1992 & 1.087 \\ 1993 & 1.067 \\ 1994 & 1.075 \\ 1995 & 1.111 \\ 1996 & 1.224 \\ 1997 & 1.199 \\ 1998 & 1.03 \\ 1999 & 1.136 \\ 2000 & 1.484 \\ 2001 & 1.42 \\ 2002 & 1.345 \\ 2003 & 1.561 \\ 2004 & 1.852 \\ 2005 & 2.27 \\ 2006 & 2.572 \end{tabular}Step by Step Solution
There are 3 Steps involved in it

Get step-by-step solutions from verified subject matter experts