

Question: Preoare a run diagram for this emergency call data. Use five minute intervals (i.e. count the calls recieved in each five-minute interval. Use 0 to
Preoare a run diagram for this emergency call data. Use five minute intervals (i.e. count the calls recieved in each five-minute interval. Use 0 to 4, 5 to 9, ect). Note two or more calls may occur in the same minute: there were three operators on duty this day. What can you conclude from the run chart? (Hint, 1:00-1:04 would be the first interval) 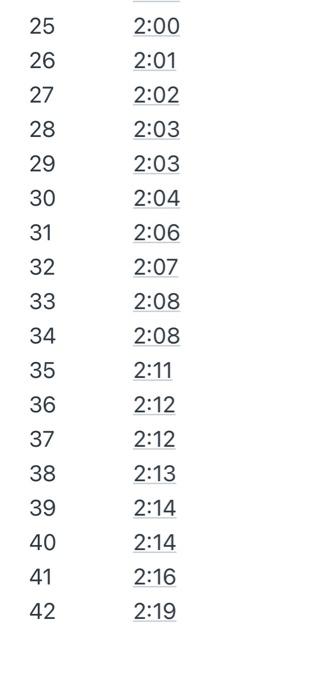
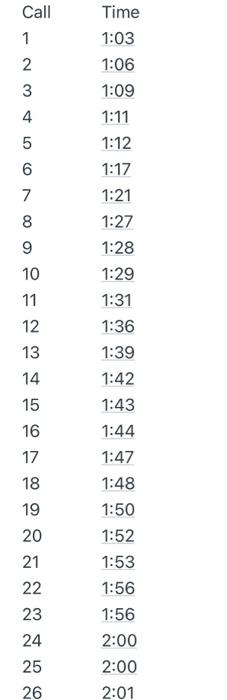
25 26 27 28 2:00 2:01 2:02 2:03 2:03 2:04 2:06 2:07 29 30 31 32 33 2:08 34 35 2:08 2:11 2:12 2:12 36 37 2:13 38 39 2:14 40 41 42 2:14 2:16 2:19 Call 1 2 3 4 5 6 7 8 9 10 11 12 Time 1:03 1:06 1:09 1:11 1:12 1:17 1:21 1:27 1:28 1:29 1:31 1:36 1:39 1:42 1:43 1:44 1:47 1:48 1:50 1:52 1:53 1:56 1:56 2:00 2:00 13 14 15 16 17 18 19 20 21 22 23 24 25 26 2:01 Step by Step Solution
There are 3 Steps involved in it
1 Expert Approved Answer
Step: 1 Unlock

Question Has Been Solved by an Expert!
Get step-by-step solutions from verified subject matter experts
Step: 2 Unlock
Step: 3 Unlock