

Question: prepare a common balance sheet using 2019 as the base year. the sheet should include assets (current and capital), liabilities (short and long term) and

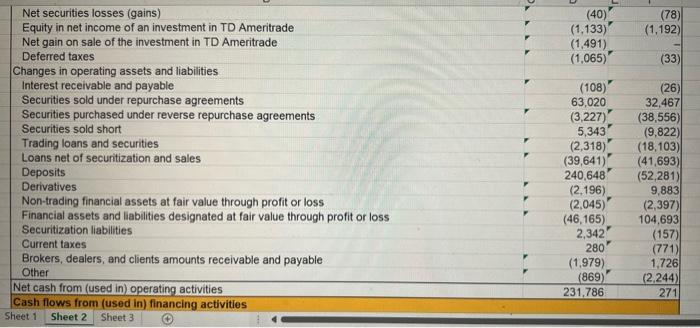
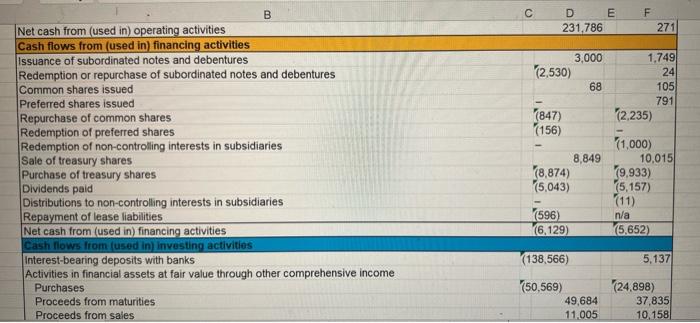
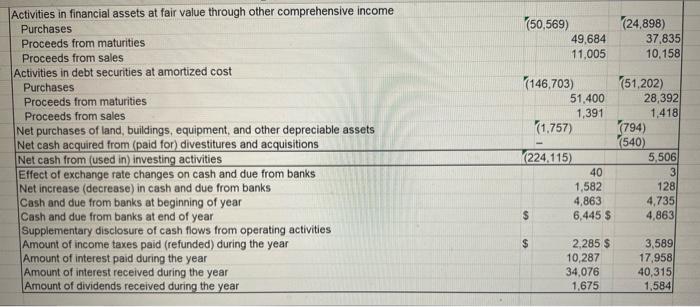
B F 2019 $14,421 C D E TD Bank Group Consolidated Statement of Cash Flows for the years ended October 31 (millions of Canadian dollars) 2020 Cash flows from (used in) operating activities Net income before income taxes, including equity in net income of an investment in TD Ameritrade $13,047 Adjustments to determine net cash flows from (used in) operating activities Provision for credit losses 7.242 Depreciation 1,324 Amortization of other intangibles 817 Net securities losses (gains) (40) Equity in net income of an investment in TD Ameritrade (1,133) Net gain on sale of the investment in TD Ameritrade (1,491) Deferred taxes (1,065) Changes in operating assets and liabilities Interest receivable and payable (108) Securities sold under repurchase agreements 63,020 Securities purchased under reverse repurchase agreements (3,227) Securities sold short 5,343 Trading loans and securities Loans net of securitization and sales (2,318) (39,641) Deposits Sheet1 240.648 Sheet 2 Sheet 3 Accessibility Invest TC 3,029 605 800 (78) (1.192) (33) (26) 32,467 (38,556) (9,822) (18,103) (41.693) (52 281) FI (40) (1,133) (1.491) (1,065) (78) (1.192) (33) (26) Net securities losses (gains) Equity in net income of an investment in TD Ameritrade Net gain on sale of the investment in TD Ameritrade Deferred taxes Changes in operating assets and liabilities Interest receivable and payable Securities sold under repurchase agreements Securities purchased under reverse repurchase agreements Securities sold short Trading loans and securities Loans net of securitization and sales Deposits Derivatives Non-trading financial assets at fair value through profit or loss Financial assets and liabilities designated at fair value through profit or loss Securitization liabilities Current taxes Brokers, dealers, and clients amounts receivable and payable Other Net cash from (used in) operating activities Cash flows from (used in) financing activities Sheet1 Sheet 2 Sheet 3 (108) 63,020 (3,227) 5,343 (2,318) (39,641) 240,648 (2.196) (2,045) (46,165) 2,342 280 (1.979) (869) 231,786 32,467 (38,556) (9,822) (18,103) (41,693 (52,281) 9,883 (2,397) 104,693 (157) (771) 1,726 (2,244) 271 C F D E 231,786 F 271 3,000 (2,530) 68 (847) (156) B Net cash from (used in) operating activities Cash flows from (used in) financing activities Issuance of subordinated notes and debentures Redemption or repurchase of subordinated notes and debentures Common shares issued Preferred shares issued Repurchase of common shares Redemption of preferred shares Redemption of non-controlling interests in subsidiaries Sale of treasury shares Purchase of treasury shares Dividends paid Distributions to non-controlling interests in subsidiaries Repayment of lease liabilities Net cash from (used in) financing activities Cash flows from (used in) Investing activities Interest-bearing deposits with banks Activities in financial assets at fair value through other comprehensive income Purchases Proceeds from maturities Proceeds from sales 1,749 24 105 791 12,235) (1,000) 10,015 19.933) (5,157) (11) n/a (5.652) 8,849 18,874) (5,043) (596) (6,129) (138,566) 5,137 (50,569) 49,684 11.005 (24.898) 37,835 10.158 (50,569) 49,684 11.005 (24,898) 37.835 10,158 Activities in financial assets at fair value through other comprehensive income Purchases Proceeds from maturities Proceeds from sales Activities in debt securities at amortized cost Purchases Proceeds from maturities Proceeds from sales Net purchases of land, buildings, equipment, and other depreciable assets Net cash acquired from (paid for) divestitures and acquisitions Net cash from (used in) investing activities Effect of exchange rate changes on cash and due from banks Net increase (decrease) in cash and due from banks Cash and due from banks at beginning of year Cash and due from banks at end of year Supplementary disclosure of cash flows from operating activities Amount of income taxes paid (refunded) during the year Amount of interest paid during the year Amount of interest received during the year Amount of dividends received during the year (146,703) (51,202) 51,400 28,392 1,391 1,418 (1.757) (794) (540) (224.115) 5,506 40 3 1,582 128 4,863 4,735 $ 6,445 $ 4,863 $ 2.285 $ 10,287 34,076 1.675 3,589 17,958 40,315 1,584 B F 2019 $14,421 C D E TD Bank Group Consolidated Statement of Cash Flows for the years ended October 31 (millions of Canadian dollars) 2020 Cash flows from (used in) operating activities Net income before income taxes, including equity in net income of an investment in TD Ameritrade $13,047 Adjustments to determine net cash flows from (used in) operating activities Provision for credit losses 7.242 Depreciation 1,324 Amortization of other intangibles 817 Net securities losses (gains) (40) Equity in net income of an investment in TD Ameritrade (1,133) Net gain on sale of the investment in TD Ameritrade (1,491) Deferred taxes (1,065) Changes in operating assets and liabilities Interest receivable and payable (108) Securities sold under repurchase agreements 63,020 Securities purchased under reverse repurchase agreements (3,227) Securities sold short 5,343 Trading loans and securities Loans net of securitization and sales (2,318) (39,641) Deposits Sheet1 240.648 Sheet 2 Sheet 3 Accessibility Invest TC 3,029 605 800 (78) (1.192) (33) (26) 32,467 (38,556) (9,822) (18,103) (41.693) (52 281) FI (40) (1,133) (1.491) (1,065) (78) (1.192) (33) (26) Net securities losses (gains) Equity in net income of an investment in TD Ameritrade Net gain on sale of the investment in TD Ameritrade Deferred taxes Changes in operating assets and liabilities Interest receivable and payable Securities sold under repurchase agreements Securities purchased under reverse repurchase agreements Securities sold short Trading loans and securities Loans net of securitization and sales Deposits Derivatives Non-trading financial assets at fair value through profit or loss Financial assets and liabilities designated at fair value through profit or loss Securitization liabilities Current taxes Brokers, dealers, and clients amounts receivable and payable Other Net cash from (used in) operating activities Cash flows from (used in) financing activities Sheet1 Sheet 2 Sheet 3 (108) 63,020 (3,227) 5,343 (2,318) (39,641) 240,648 (2.196) (2,045) (46,165) 2,342 280 (1.979) (869) 231,786 32,467 (38,556) (9,822) (18,103) (41,693 (52,281) 9,883 (2,397) 104,693 (157) (771) 1,726 (2,244) 271 C F D E 231,786 F 271 3,000 (2,530) 68 (847) (156) B Net cash from (used in) operating activities Cash flows from (used in) financing activities Issuance of subordinated notes and debentures Redemption or repurchase of subordinated notes and debentures Common shares issued Preferred shares issued Repurchase of common shares Redemption of preferred shares Redemption of non-controlling interests in subsidiaries Sale of treasury shares Purchase of treasury shares Dividends paid Distributions to non-controlling interests in subsidiaries Repayment of lease liabilities Net cash from (used in) financing activities Cash flows from (used in) Investing activities Interest-bearing deposits with banks Activities in financial assets at fair value through other comprehensive income Purchases Proceeds from maturities Proceeds from sales 1,749 24 105 791 12,235) (1,000) 10,015 19.933) (5,157) (11) n/a (5.652) 8,849 18,874) (5,043) (596) (6,129) (138,566) 5,137 (50,569) 49,684 11.005 (24.898) 37,835 10.158 (50,569) 49,684 11.005 (24,898) 37.835 10,158 Activities in financial assets at fair value through other comprehensive income Purchases Proceeds from maturities Proceeds from sales Activities in debt securities at amortized cost Purchases Proceeds from maturities Proceeds from sales Net purchases of land, buildings, equipment, and other depreciable assets Net cash acquired from (paid for) divestitures and acquisitions Net cash from (used in) investing activities Effect of exchange rate changes on cash and due from banks Net increase (decrease) in cash and due from banks Cash and due from banks at beginning of year Cash and due from banks at end of year Supplementary disclosure of cash flows from operating activities Amount of income taxes paid (refunded) during the year Amount of interest paid during the year Amount of interest received during the year Amount of dividends received during the year (146,703) (51,202) 51,400 28,392 1,391 1,418 (1.757) (794) (540) (224.115) 5,506 40 3 1,582 128 4,863 4,735 $ 6,445 $ 4,863 $ 2.285 $ 10,287 34,076 1.675 3,589 17,958 40,315 1,584
Step by Step Solution
There are 3 Steps involved in it

Get step-by-step solutions from verified subject matter experts