

Question: Prepare a financial statement analysis for the company. The analysis must include the calculation of the following ratios for three years and short comments on
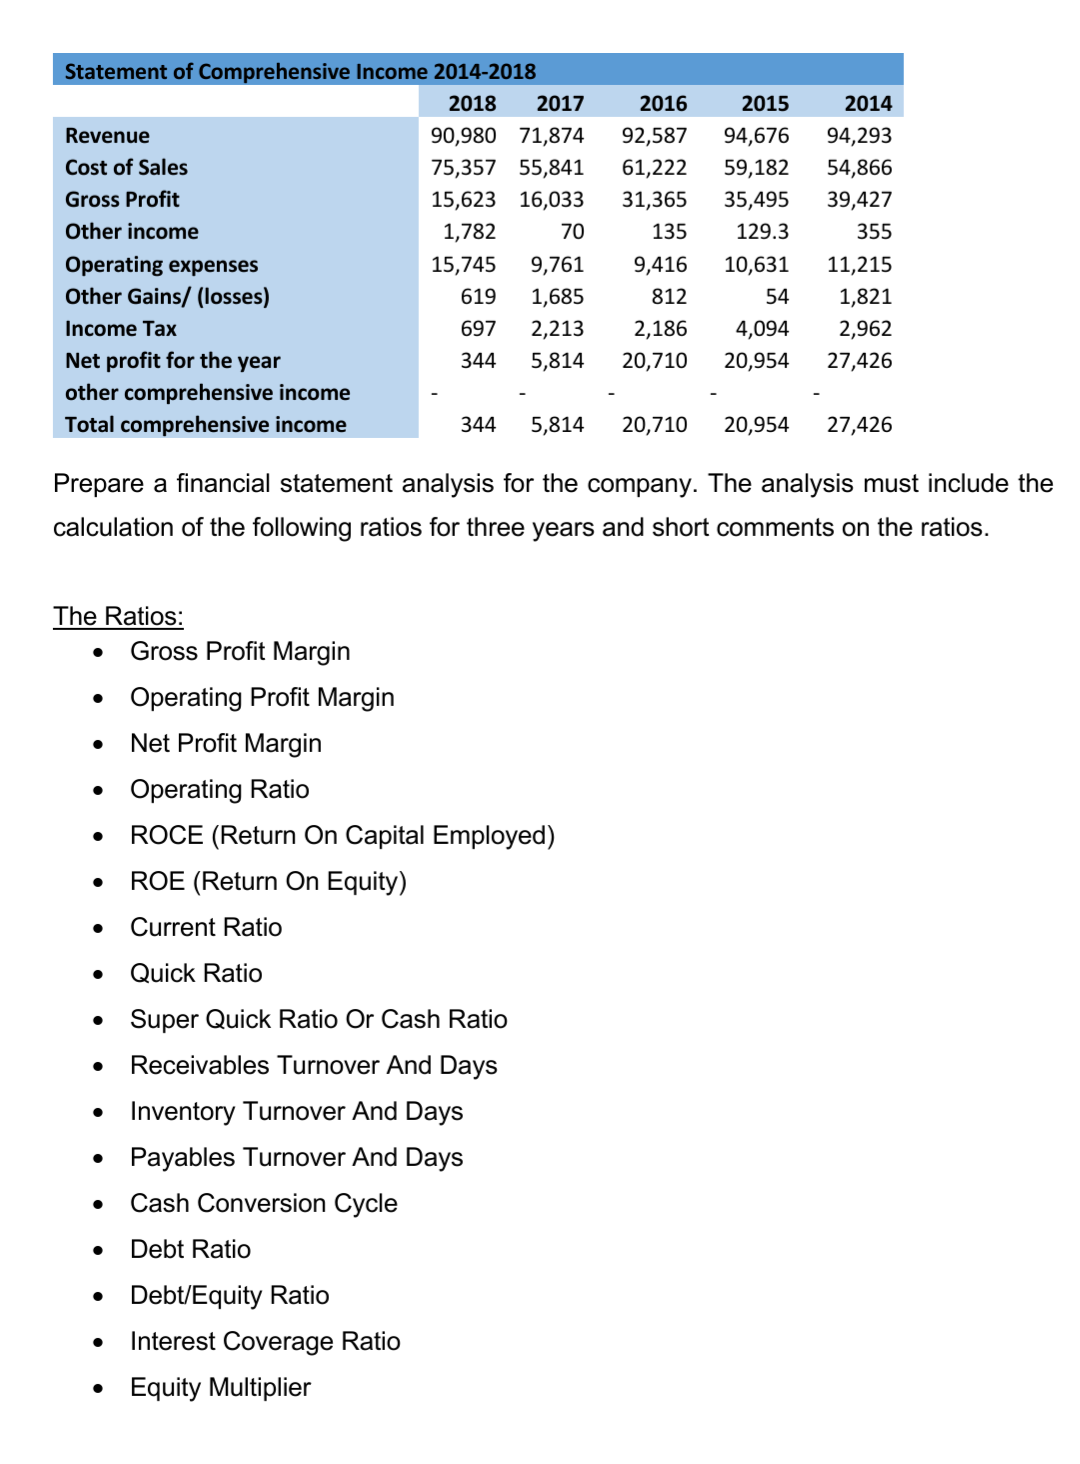
Prepare a financial statement analysis for the company. The analysis must include the calculation of the following ratios for three years and short comments on the ratios.
The Ratios:
Gross Profit Margin
Operating Profit Margin
Net Profit Margin
Operating Ratio
ROCE (Return On Capital Employed)
ROE (Return On Equity)
Current Ratio
Quick Ratio
Super Quick Ratio Or Cash Ratio
Receivables Turnover And Days
Inventory Turnover And Days
Payables Turnover And Days
Cash Conversion Cycle
Debt Ratio
Debt/Equity Ratio
Interest Coverage Ratio
Equity Multiplier
2014 Statement of Comprehensive Income 2014-2018 2018 2017 Revenue 90,980 71,874 Cost of Sales 75,357 55,841 Gross Profit 15,623 16,033 Other income 1,782 70 Operating expenses 15,745 9,761 Other Gains/ (losses) 619 1,685 Income Tax 697 2,213 Net profit for the year 344 5,814 other comprehensive income Total comprehensive income 344 5,814 2016 92,587 61,222 31,365 135 9,416 812 2,186 20,710 2015 94,676 59,182 35,495 129.3 10,631 54 4,094 20,954 94,293 54,866 39,427 355 11,215 1,821 2,962 27,426 20,710 20,954 27,426 Prepare a financial statement analysis for the company. The analysis must include the calculation of the following ratios for three years and short comments on the ratios. . . The Ratios: Gross Profit Margin Operating Profit Margin Net Profit Margin Operating Ratio ROCE (Return On Capital Employed) ROE (Return On Equity) Current Ratio . Quick Ratio Super Quick Ratio Or Cash Ratio Receivables Turnover And Days Inventory Turnover And Days Payables Turnover And Days Cash Conversion Cycle Debt Ratio Debt/Equity Ratio Interest Coverage Ratio Equity Multiplier 2014 Statement of Comprehensive Income 2014-2018 2018 2017 Revenue 90,980 71,874 Cost of Sales 75,357 55,841 Gross Profit 15,623 16,033 Other income 1,782 70 Operating expenses 15,745 9,761 Other Gains/ (losses) 619 1,685 Income Tax 697 2,213 Net profit for the year 344 5,814 other comprehensive income Total comprehensive income 344 5,814 2016 92,587 61,222 31,365 135 9,416 812 2,186 20,710 2015 94,676 59,182 35,495 129.3 10,631 54 4,094 20,954 94,293 54,866 39,427 355 11,215 1,821 2,962 27,426 20,710 20,954 27,426 Prepare a financial statement analysis for the company. The analysis must include the calculation of the following ratios for three years and short comments on the ratios. . . The Ratios: Gross Profit Margin Operating Profit Margin Net Profit Margin Operating Ratio ROCE (Return On Capital Employed) ROE (Return On Equity) Current Ratio . Quick Ratio Super Quick Ratio Or Cash Ratio Receivables Turnover And Days Inventory Turnover And Days Payables Turnover And Days Cash Conversion Cycle Debt Ratio Debt/Equity Ratio Interest Coverage Ratio Equity Multiplier
Step by Step Solution
There are 3 Steps involved in it

Get step-by-step solutions from verified subject matter experts