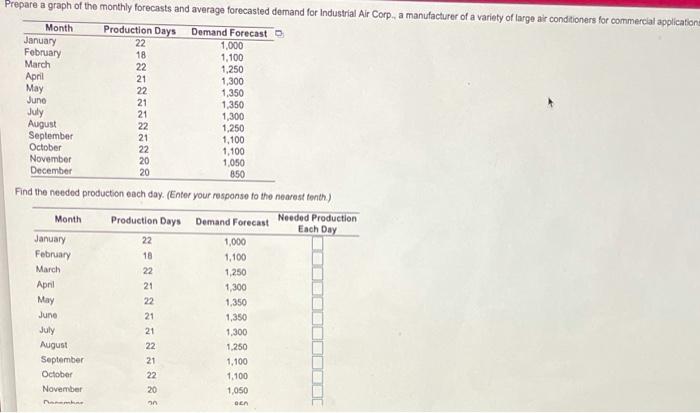
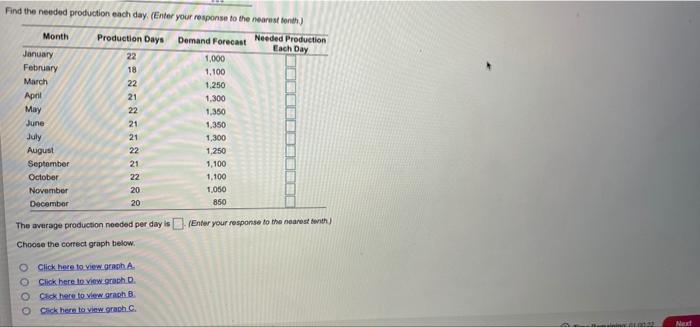
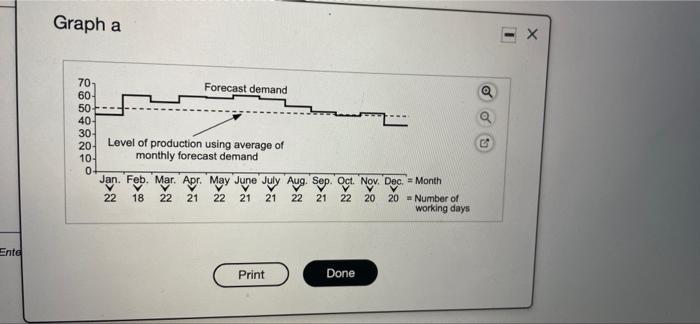
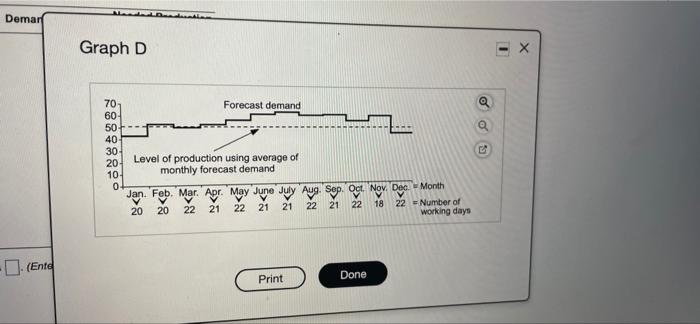
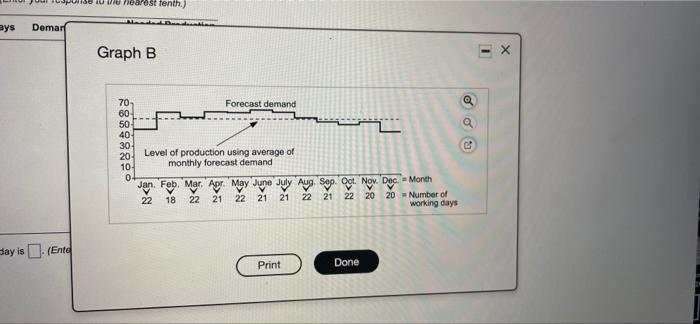
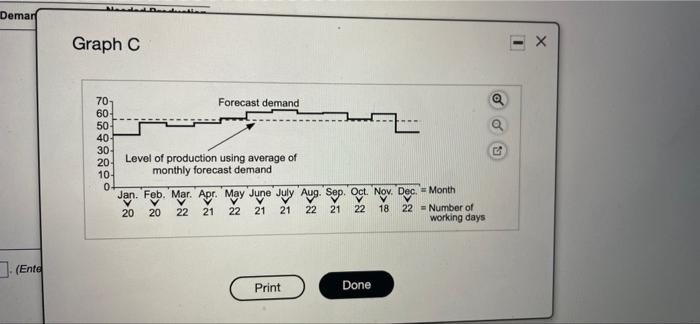
Question: Prepare a graph of the monthly forecasts and average forecasted demand for Industrial Air Corp. a manufacturer of a variety of large air conditioners for

Prepare a graph of the monthly forecasts and
Prepare a graph of the monthly forecasts and average forecasted demand for Industrial Air Corp. a manufacturer of a variety of large air conditioners for commercial application Month Production Days Demand Forecast January 22 1.000 February 18 1.100 March 22 1.250 April 21 1,300 May 22 1.350 Juno 21 1,350 July 21 1,300 August 22 1,250 September 21 1,100 October 22 1,100 November 20 1,050 December 20 850 Find the needed production each day. (Enter your response to the nearest tonth) Month Production Days Demand Forecast Needed Production Each Day January 22 1,000 February 1.100 March 22 1,250 April 21 1,300 May 22 1,350 June 21 1.350 July 1.300 August 22 September 21 1.100 October 1.100 November 1.050 NONSENSE 1.250 DER Find the needed production each day (Enter your response to the nearest th) Month Production Days Demand Forecast Needed Production Each Day January 1,000 February 18 1,100 March 22 1.250 April 21 1.300 May 22 1,350 June 1,350 July 1,300 August 22 1,250 September 1,100 October 22 1.100 November 1.050 December 850 NENANENAN&& The average production needed per day is (Enter your response to the nearest toith Choose the correct graph below. Click here to view.graph A. Click here to view.graph D. Click here to view grach B Click here to view grach. Next Graph a I Forecast demand 70 60- 50 40 30 20 10 0- Level of production using average of monthly forecast demand Jan Feb Mar Apr May June July Aug Sep Oct Nov Dec. = Month 22 18 22 21 22 21 21 22 22 20 20 - Number of working days 21 Ente Print Done VANDA Demart Graph D T 70 Forecast demand 60 50 40 30 20 Level of production using average of 10- monthly forecast demand Jan Feb Mar Apr May June July Aug Sep Oct Nov Dec Month 20 20 22 21 22 21 21 22 21 22 18 22 Number of working days 0 -J. (Ento Print Done our pois o nearest fenth.) ays Demar Graph B 1 do a 70 Forecast demand 60 50 40 30 20 Level of production using average of 10 monthly forecast demand 0 Jan Feb Mar Apr May June July Aug Sep Oct Nov Dec - Month 22 18 22 21 22 21 21 22 21 22 20 20 Number of working days Say is (Entd Print Done MD Demar 1 Graph C Forecast demand 70 60 50 40 30 20 10 0 Level of production using average of monthly forecast demand Jan Feb Mar Apr May June July Aug Sep Oct Nov Dec - Month 20 20 22 21 22 21 21 22 21 22 18 22 Number of working days J. (Ente Print Done

Step by Step Solution

There are 3 Steps involved in it

1 Expert Approved Answer
Step: 1 Unlock blur-text-image
Question Has Been Solved by an Expert!

Get step-by-step solutions from verified subject matter experts

Step: 2 Unlock
Step: 3 Unlock

Students Have Also Explored These Related General Management Questions!