

Question: Prepare a PowerPoint slide that displays the data below using text and charts to depict the data: a. The Development Review Applications chart should depict
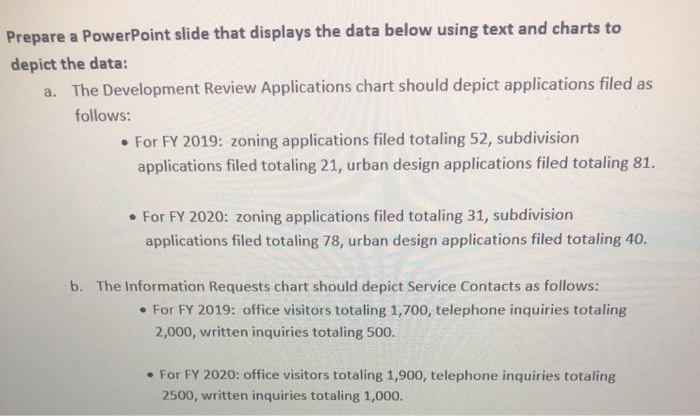
Prepare a PowerPoint slide that displays the data below using text and charts to depict the data: a. The Development Review Applications chart should depict applications filed as follows: For FY 2019: zoning applications filed totaling 52, subdivision applications filed totaling 21, urban design applications filed totaling 81. For FY 2020: zoning applications filed totaling 31, subdivision applications filed totaling 78, urban design applications filed totaling 40. b. The Information Requests chart should depict Service Contacts as follows: For FY 2019: office visitors totaling 1,700, telephone inquiries totaling 2,000, written inquiries totaling 500. For FY 2020: office visitors totaling 1,900, telephone inquiries totaling 2500, written inquiries totaling 1,000
Step by Step Solution
There are 3 Steps involved in it

Get step-by-step solutions from verified subject matter experts