

Question: Prepare a scatter graph based on 10 months of data. Please show work. Use the following information for Problems 3-43 and 3-44 Farnsworth Company has
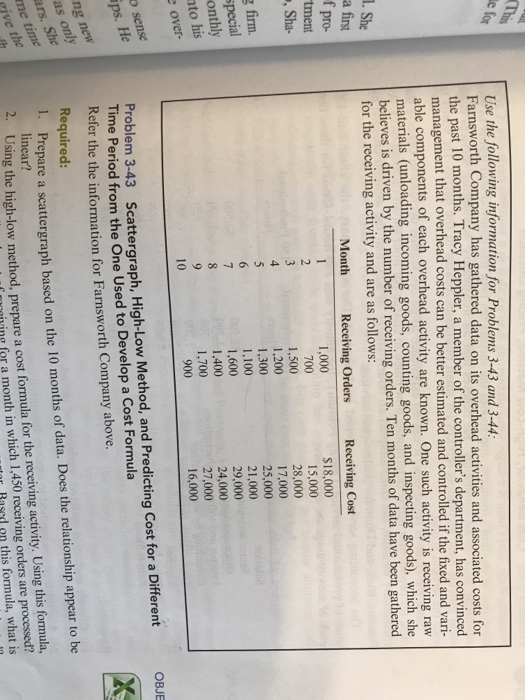
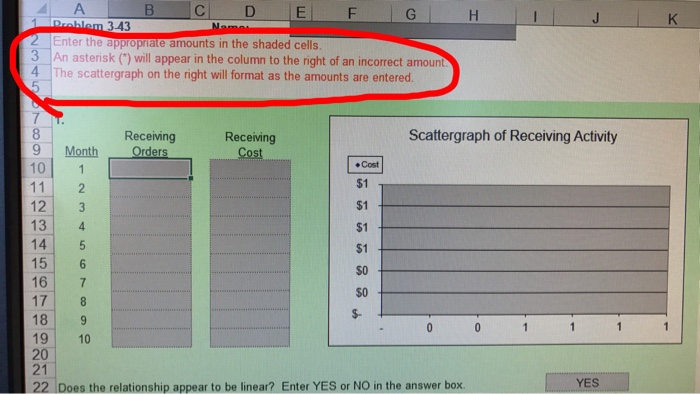
Use the following information for Problems 3-43 and 3-44 Farnsworth Company has gathered data on its overhead activities and associated costs for the past 10 months. Tracy Heppler, a member of the controller's department, has convinced management that overhead costs can be better estimated and controlled if the fixed and vari- able components of each overhead activity are known. One such activity is receiving raw materials (unloading incoming goods, counting goods, and inspecting goods), which she believes is driven by the number of receiving orders. Ten months of data have been gathered for the receiving activity and are as follows: 1. She Month Receiving Orders Receiving Cost 1,000 700 1,500 1,200 1,300 1,100 1,600 1,400 1,700 $18,000 15,000 28,000 17,000 25,000 21,000 29,000 24,000 27,000 16,000 tment Sha- firm. onthly to his 10 OBJE Problem 3-43 Scattergraph, High-Low Method, and Predicting Cost for a Different e Period from the One Used to Develop a Cost Formula Refer the the information for Farnsworth Company above. Required: 1. P 2. repare a scattergraph based on the 10 months of data. Does the relationship appear to be linear? Using the high-low method, prepare a cost formula for the receiving activity. Using this formula, ivine for a month in which 1,450 receiving orders are processed? Based on this formula, what is
Step by Step Solution
There are 3 Steps involved in it

Get step-by-step solutions from verified subject matter experts