

Question: Prepare a schedule showing a vertical analysis for 2020 Operating data for Manning Corporation are presented below. 2020 Net sales $500,000 Cost of goods sold
Prepare a schedule showing a vertical analysis for 2020
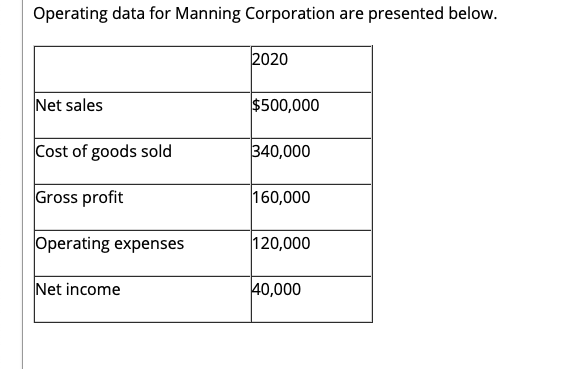
Operating data for Manning Corporation are presented below. 2020 Net sales $500,000 Cost of goods sold 340,000 Gross profit 160,000 Operating expenses 120,000 Net income 40,000
Step by Step Solution
There are 3 Steps involved in it
1 Expert Approved Answer
Step: 1 Unlock

Question Has Been Solved by an Expert!
Get step-by-step solutions from verified subject matter experts
Step: 2 Unlock
Step: 3 Unlock