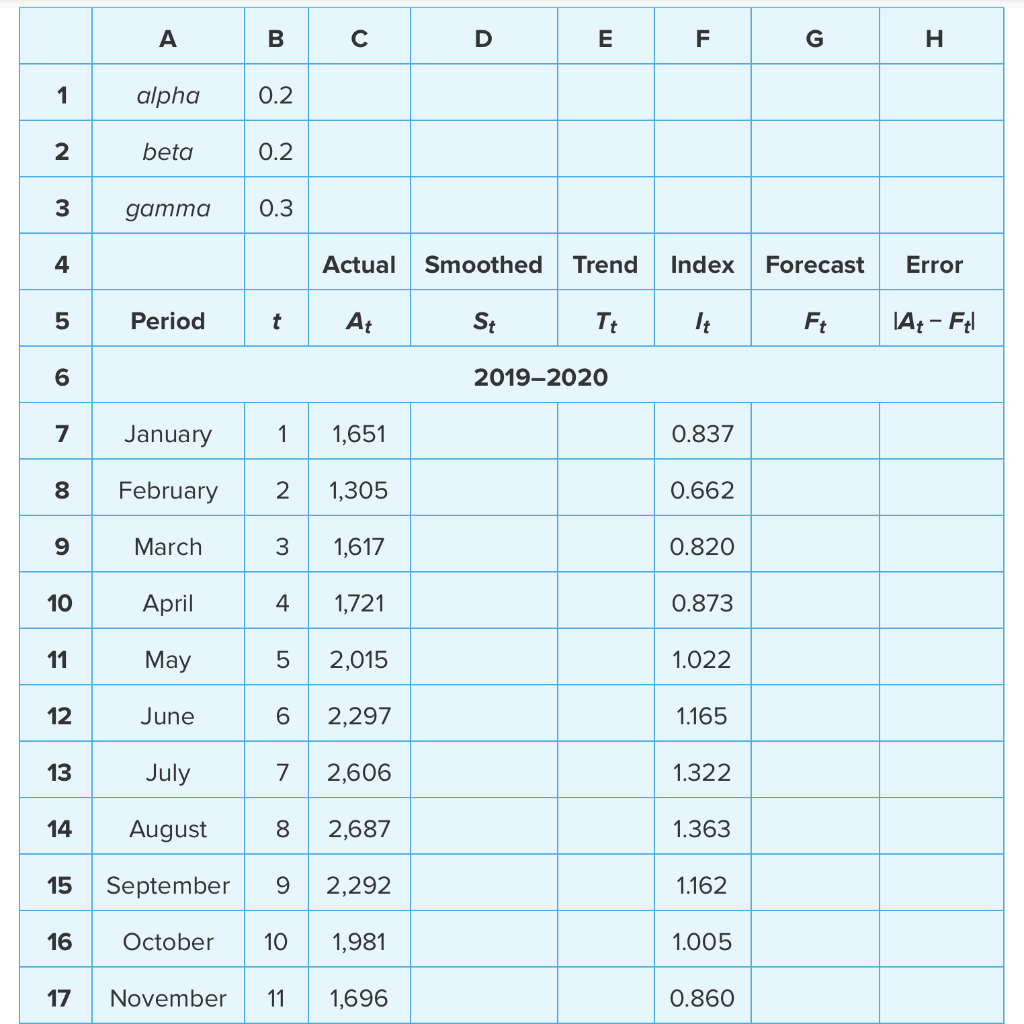
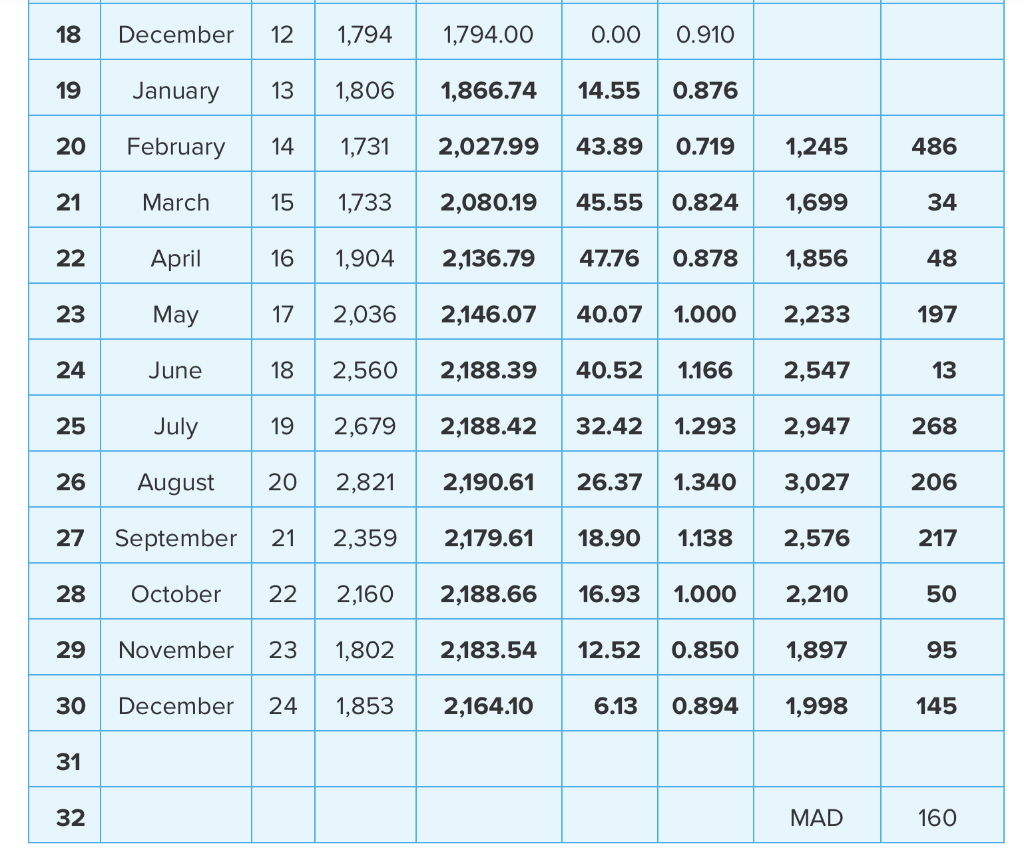
Question: Prepare a spreadsheet model for the ferry passenger data in Table 14.6, and recalculate the forecasts using an of 0.3, a of 0.1, and a
Prepare a spreadsheet model for the ferry passenger data in Table 14.6, and recalculate the forecasts using an of 0.3, a of 0.1, and a of 0.2. Has this change in the smoothing constants improved the MAD?


A B D E F G I 1 alpha 0.2 2 beta 0.2 3 gamma 0.3 4 Actual Smoothed Trend Index Forecast Error 5 Period t At St Te It Ft At - Ft 6 2019-2020 7 January 1 1,651 0.837 00 8 February 2 1,305 0.662 9 March 3 1,617 0.820 10 April 4 1,721 0.873 11 May 5 2,015 1.022 12 June 6 2,297 1.165 13 July 7 2,606 1.322 14 August 00 8 2,687 1.363 15 September 9 2,292 1.162 16 October 10 1,981 1.005 17 November 11 1,696 0.860 18 December 12 1,794 1,794.00 0.00 0.910 19 January 13 1,806 1,866.74 14.55 0.876 20 February 14 1,731 2,027.99 43.89 0.719 1,245 486 21 March 15 1,733 2,080.19 45.55 0.824 1,699 34 22 April 16 1,904 2,136.79 47.76 0.878 1,856 48 23 May 17 2,036 2,146.07 40.07 1.000 2,233 197 24 June 18 2,560 2,188.39 40.52 1.166 2,547 13 25 July 19 2,679 2,188.42 32.42 1.293 2,947 268 26 August 20 2,821 2,190.61 26.37 1.340 3,027 206 27 September 21 2,359 2,179.61 18.90 1.138 2,576 217 28 October 22 2,160 2,188.66 16.93 1.000 2,210 50 29 November 23 1,802 2,183.54 12.52 0.850 1,897 95 30 December 24 1,853 2,164.10 6.13 0.894 1,998 145 31 32 MAD 160