

Question: Prepare a spreadsheet that will provide a report for both departments using FIFO and the WA assumptions. The Report is to look like Exhibits 18-4
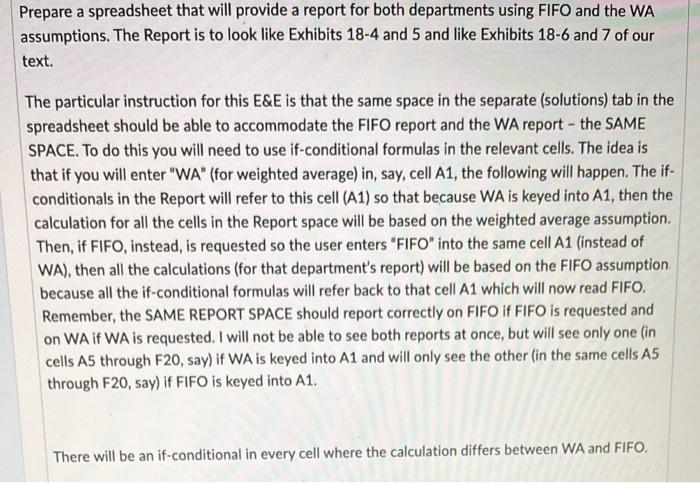
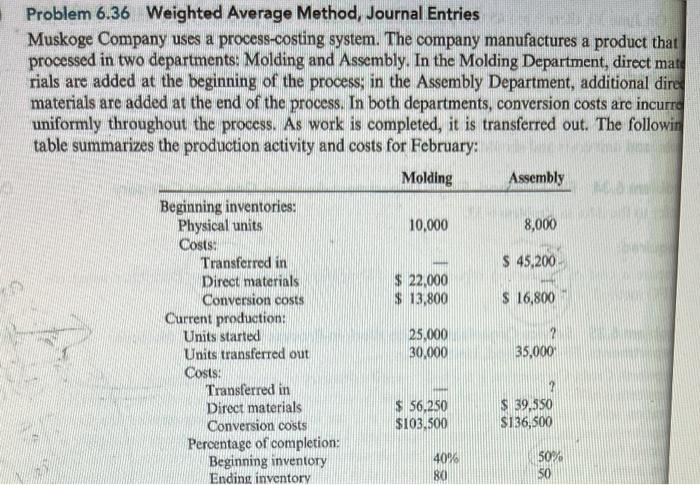
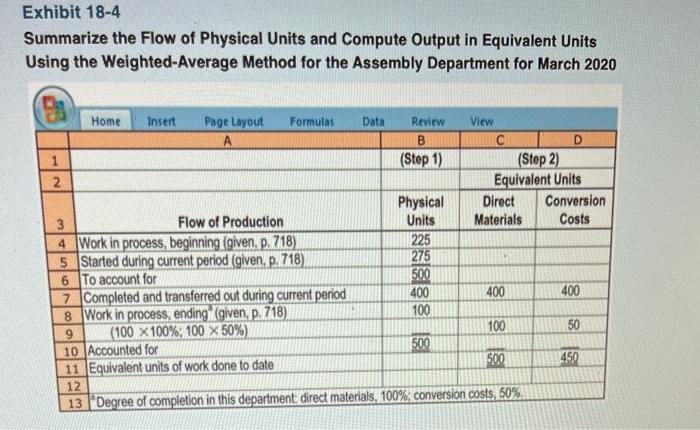
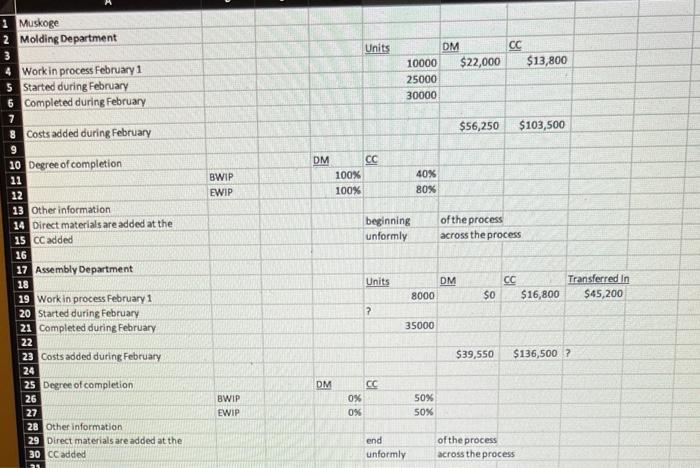
Prepare a spreadsheet that will provide a report for both departments using FIFO and the WA assumptions. The Report is to look like Exhibits 18-4 and 5 and like Exhibits 18-6 and 7 of our text. - The particular instruction for this E&E is that the same space in the separate (solutions) tab in the spreadsheet should be able to accommodate the FIFO report and the WA report - the SAME SPACE. To do this you will need to use if-conditional formulas in the relevant cells. The idea is that if you will enter "WA" (for weighted average) in, say, cell A1, the following will happen. The if- conditionals in the Report will refer to this cell (A1) so that because WA is keyed into A1, then the calculation for all the cells in the Report space will be based on the weighted average assumption. Then, if FIFO, instead, is requested so the user enters "FIFO" into the same cell A1 (instead of WA), then all the calculations (for that department's report) will be based on the FIFO assumption because all the if-conditional formulas will refer back to that cell A1 which will now read FIFO. Remember, the SAME REPORT SPACE should report correctly on FIFO if FIFO is requested and on WA if WA is requested. I will not be able to see both reports at once, but will see only one (in cells A5 through F20, say) if WA is keyed into A1 and will only see the other in the same cells A5 through F20, say) if FIFO is keyed into A1. There will be an if-conditional in every cell where the calculation differs between WA and FIFO. Problem 6.36 Weighted Average Method, Journal Entries Muskoge Company uses a process-costing system. The company manufactures a product that processed in two departments. Molding and Assembly. In the Molding Department, direct mate rials are added at the beginning of the process; in the Assembly Department, additional dire materials are added at the end of the process. In both departments, conversion costs are incurre uniformly throughout the process. As work is completed, it is transferred out. The followin table summarizes the production activity and costs for February: Molding Assembly Beginning inventories: Physical units 10,000 8,000 Costs: Transferred in $ 45,200 Direct materials $ 22,000 Conversion costs $ 13,800 S 16,800 Current production: Units started 25,000 2 Units transferred out 30,000 35,000 Costs: Transferred in Direct materials $ 56,250 $ 39,550 Conversion costs $103,500 S136,500 Percentage of completion: Beginning inventory 40% 50% Ending inventory 80 50 Units OM 1 Muskoge 2 Molding Department 3 4 Work in process February 1 5 Started during February 6 Completed during February $22,000 CC $13,800 10000 25000 30000 $56,250 $103,500 8 Costs added during February 10 Degree of completion 18 BWIP EWIP DM 100% 100% 40% 80% beginning unformly of the process across the process Units CC DM 8000 Transferred In $45,200 $0 $16,800 2 12 13 Other information 14 Direct materials are added at the 15 cc added 16 17 Assembly Department 18 19 Work in process February 1 20 Started during February 21 Completed during February 22 23 Costs added during February 24 25 Degree of completion 26 27 28 Other information 29 Direct materials are added at the 30 CC added 35000 $39,550 $136,500? DM BWIP EWIP CC 0% 0% 50% 50% end unformly of the process across the process
Step by Step Solution
There are 3 Steps involved in it

Get step-by-step solutions from verified subject matter experts