

Question: Prepare a table to show the process described in the chapter and depicted in the DFDs (Figures 13.3, 13.4, and 13.6). The first column should
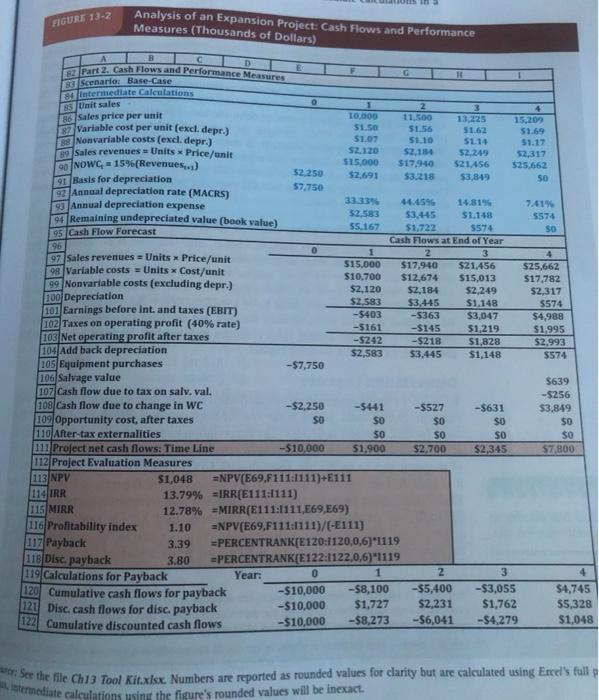
Prepare a table to show the process described in the chapter and depicted in the DFDs (Figures 13.3, 13.4, and 13.6). The first column should show the 2 major steps described in the level 0 diagram. The second column should show the 5 subsidiary functions as shown in Figures 13.4 and 13.6. The third column should include all inputs into the subsidiary function identified in column 2. The fourth column should include all outputs from the subsidiary function identified in column 2. Make sure to include databases as either inputs or outputs, Figire 13-2 provides a visual of how it should look
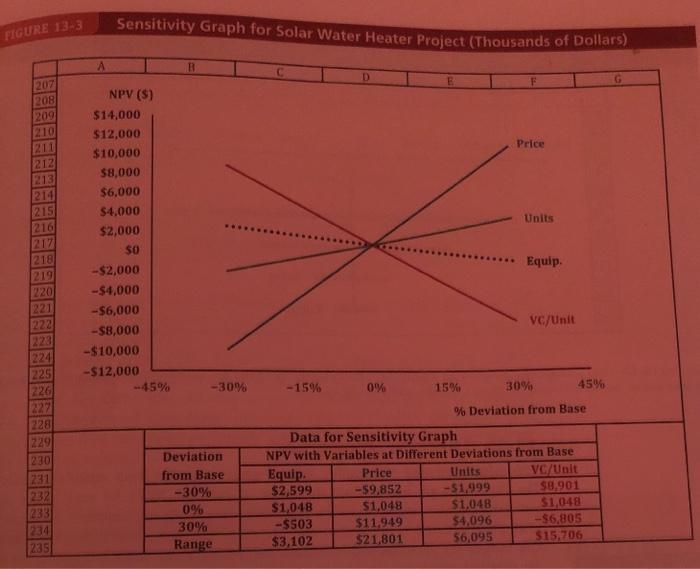
Sensitivity Graph for Solar Water Heater Project (Thousands of Dollars) FIGURE 13-3 B. 207 208 209 210 211 212 213 214 215 216 217 218 219 220 NPV (S) G. $14,000 $12,000 $10,000 Price $8,000 $6,000 $4,000 $2,000 Units $0 -$2,000 Equip. -$4,000 221 222 223 224 225 226 227 228 229 -$6,000 -$8,000 vc/Unit -$10,000 -$12,000 -45% -30% -15% 0% 15% 30% 45% % Deviation from Base Data for Sensitivity Graph 230 Deviation NPV with Variables at Different Deviations from Base 231 from Base Equip. $2,599 $1,048 -$503 Price VC/Unit $8,901 $1,048 -$6,805 $15,706 Units 232 233 234 235 -30% -$9,852 $1,048 -$1,999 $1,048 $4.096 $6,095 0% 30% $11,949 $21,801 Range $3,102
Step by Step Solution
3.39 Rating (155 Votes )
There are 3 Steps involved in it
This exercise requires knowledge of the logical process description and D... View full answer

Get step-by-step solutions from verified subject matter experts