

Question: Prepare a trend analysis chart from the following financial data for the Hook, Line and Sinker Fishing Supply Company. Net Sales Net Income Total
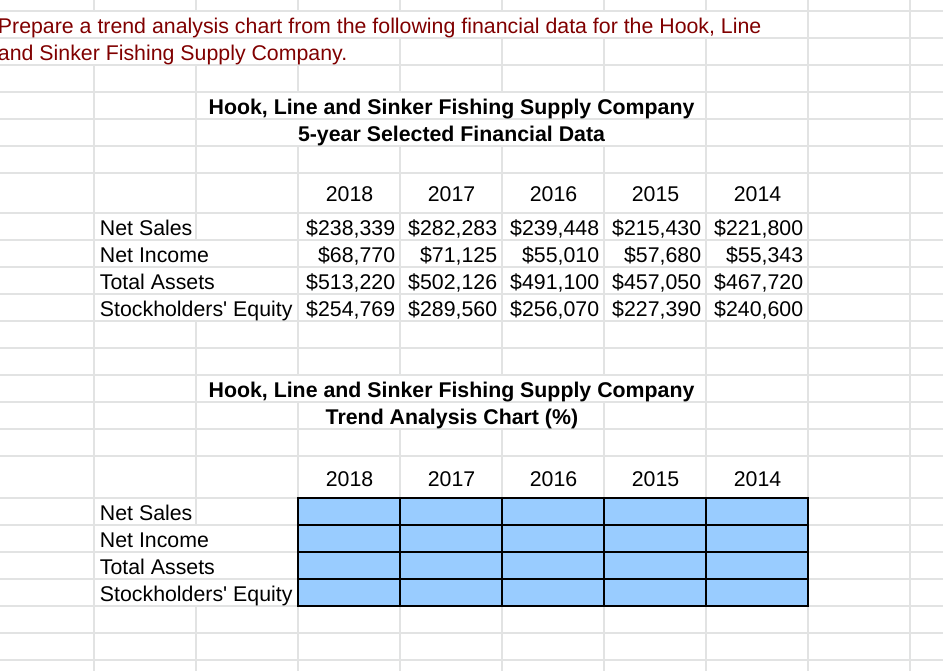
Prepare a trend analysis chart from the following financial data for the Hook, Line and Sinker Fishing Supply Company. Net Sales Net Income Total Assets Hook, Line and Sinker Fishing Supply Company 5-year Selected Financial Data 2015 2018 2017 2016 2014 $238,339 $282,283 $239,448 $215,430 $221,800 $68,770 $71,125 $55,010 $57,680 $55,343 $513,220 $502,126 $491,100 $457,050 $467,720 Stockholders' Equity $254,769 $289,560 $256,070 $227,390 $240,600 Hook, Line and Sinker Fishing Supply Company Trend Analysis Chart (%) 2018 2017 2016 2015 2014 Net Sales Net Income Total Assets Stockholders' Equity
Step by Step Solution
There are 3 Steps involved in it

Get step-by-step solutions from verified subject matter experts