

Question: Prepare a vertical analysis for both years, using the following chart. 2021 2020 2021 Percent 2020 Percent Net sales $600,000 $500,00 0 Cost of
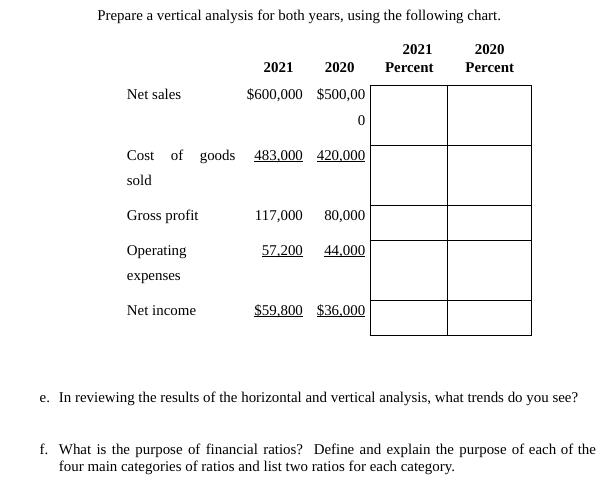
Prepare a vertical analysis for both years, using the following chart. 2021 2020 2021 Percent 2020 Percent Net sales $600,000 $500,00 0 Cost of goods 483,000 420,000 sold Gross profit 117,000 80,000 Operating 57.200 44,000 expenses Net income $59,800 $36,000 e. In reviewing the results of the horizontal and vertical analysis, what trends do you see? f. What is the purpose of financial ratios? Define and explain the purpose of each of the four main categories of ratios and list two ratios for each category.
Step by Step Solution
There are 3 Steps involved in it
1 Expert Approved Answer
Step: 1 Unlock

Question Has Been Solved by an Expert!
Get step-by-step solutions from verified subject matter experts
Step: 2 Unlock
Step: 3 Unlock