

Question: Present Or draw a SD model to show the dynamics of a system consisting of the following components of a closed system. Show a graph
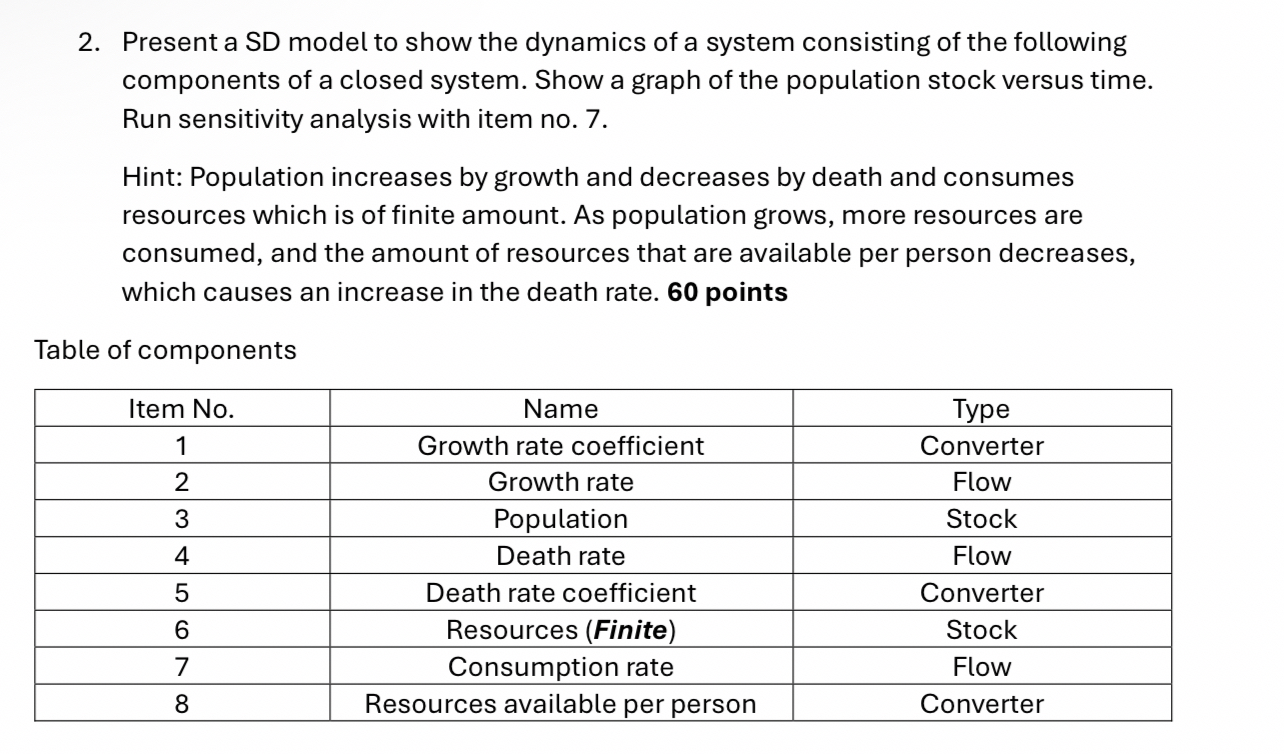
Present Or draw a SD model to show the dynamics of a system consisting of the following components of a closed system. Show a graph of the population stock versus time. Run sensitivity analysis with item no
Hint: Population increases by growth and decreases by death and consumes resources which is of finite amount. As population grows, more resources are consumed, and the amount of resources that are available per person decreases, which causes an increase in the death rate. points
Table of components
tableItem NoName,TypeGrowth rate coefficient,ConverterGrowth rate,FlowPopulation,StockDeath rate,FlowDeath rate coefficient,ConverterResources FiniteStockConsumption rate,FlowResources available per person,Converter
Step by Step Solution
There are 3 Steps involved in it
1 Expert Approved Answer
Step: 1 Unlock

Question Has Been Solved by an Expert!
Get step-by-step solutions from verified subject matter experts
Step: 2 Unlock
Step: 3 Unlock