

Question: Present the data in table 2 graphically for the variables FEV1 percent predicted and FVC percent predicted. Repeat this for the same variables in table
 Present the data in table 2 graphically for the variables FEV1 percent predicted and FVC percent predicted. Repeat this for the same variables in table 3. Comment on your graphically representations
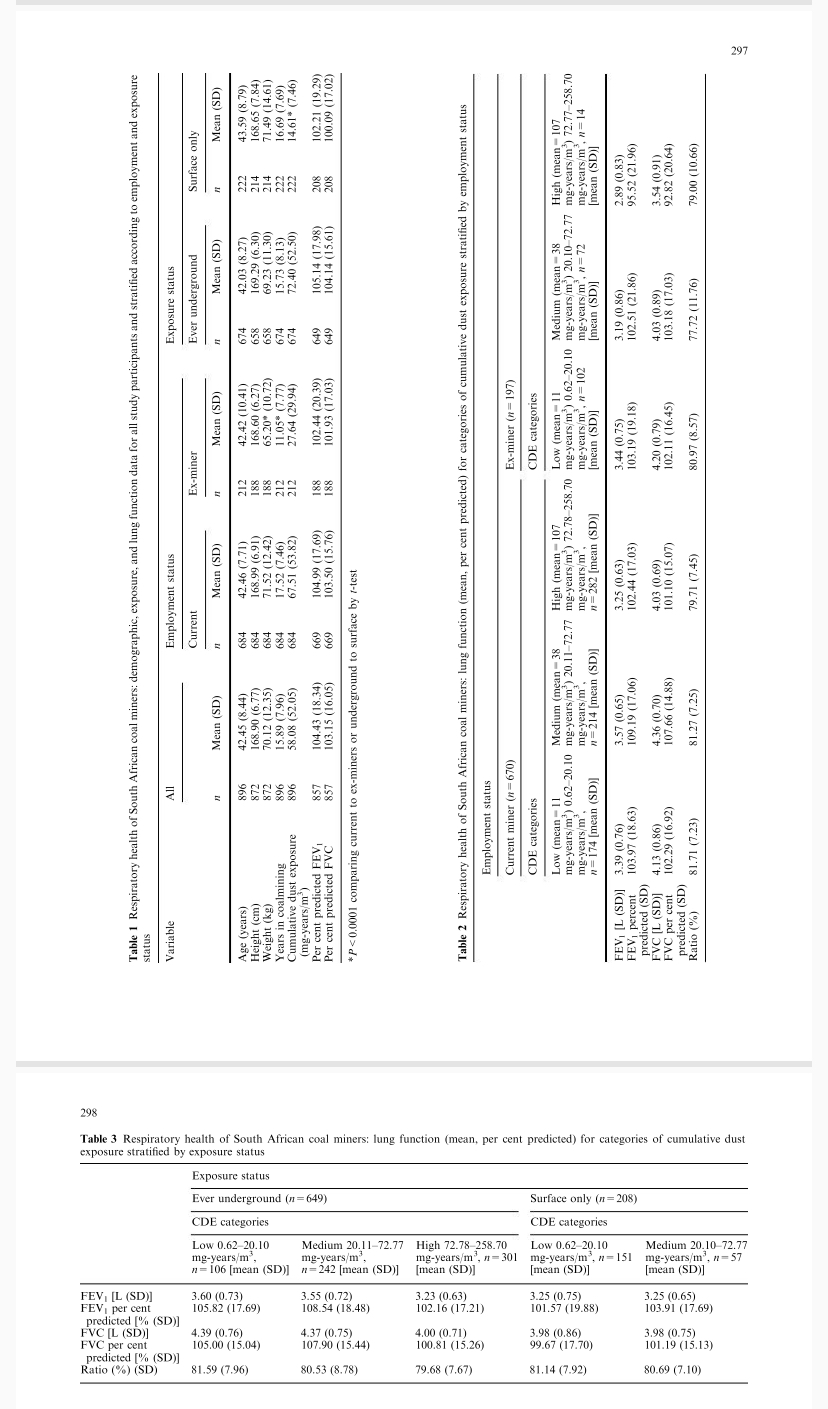
Table 3 Respiratory health of South African coal miners: lung function (mean, per cent predicted) for categories of cumulative dust exposure stratified by exposure status Table 3 Respiratory health of South African coal miners: lung function (mean, per cent predicted) for categories of cumulative dust exposure stratified by exposure status
Step by Step Solution
There are 3 Steps involved in it
1 Expert Approved Answer
Step: 1 Unlock

Question Has Been Solved by an Expert!
Get step-by-step solutions from verified subject matter experts
Step: 2 Unlock
Step: 3 Unlock