

Question: Present Value Table Present value of 1 i.e. (1 +r). Where r = discount rate n = number of periods until payment Discount rate (r)
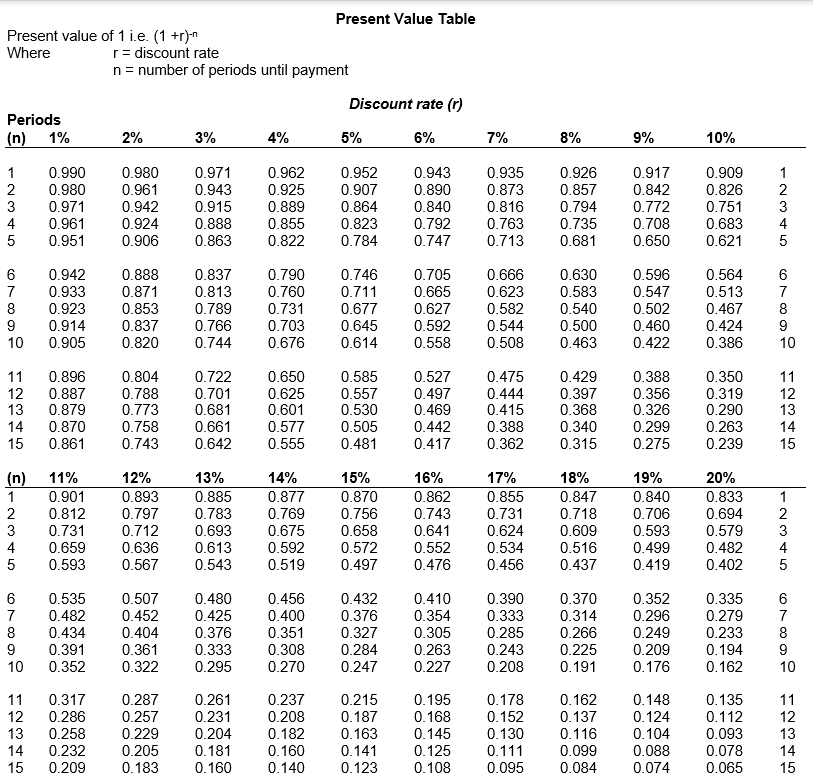
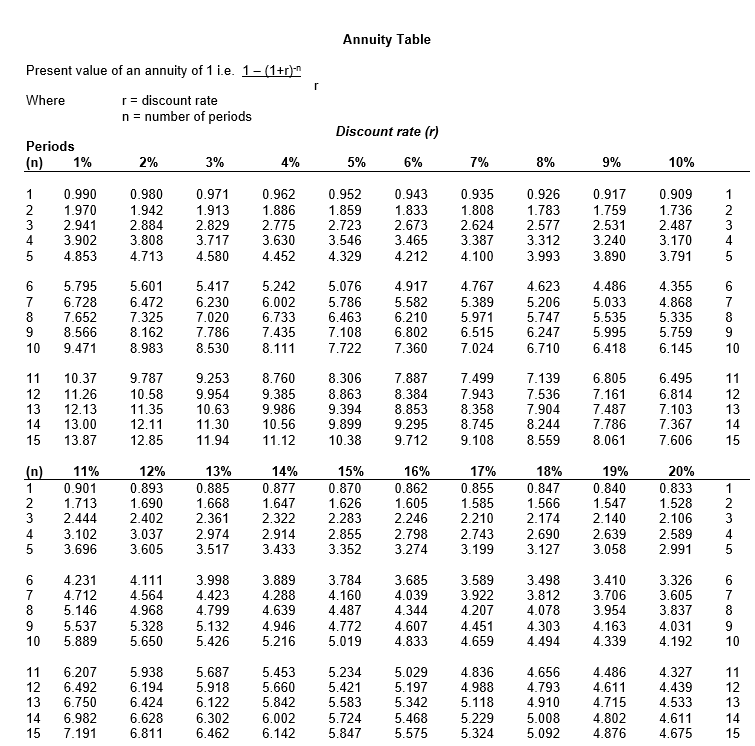
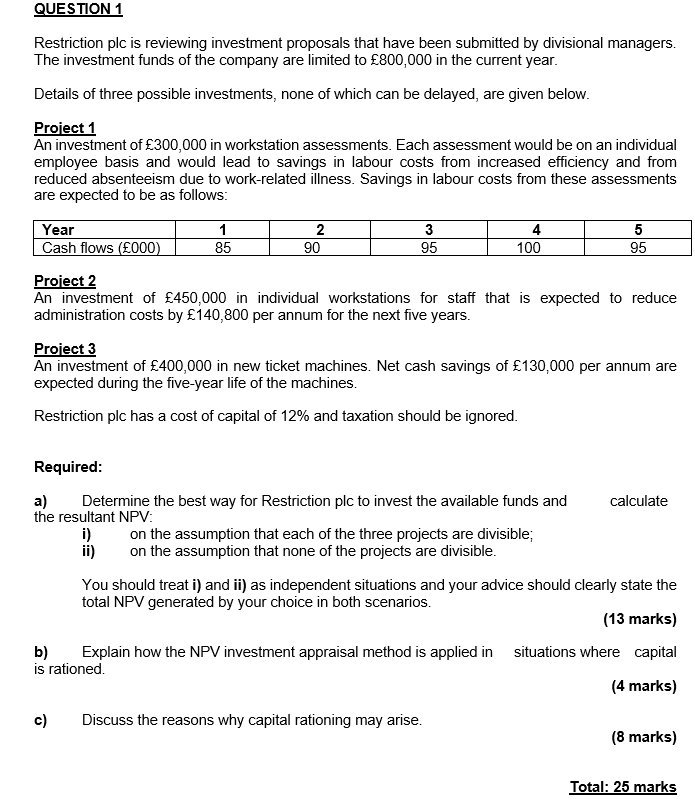
Present Value Table Present value of 1 i.e. (1 +r)." Where r = discount rate n = number of periods until payment Discount rate (r) Periods (n) 1% 2% 3% 4% 5% 6% 7% 8% 9% 10% 1 2 3 4 5 0.990 0.980 0.971 0.961 0.951 0.980 0.961 0.942 0.924 0.906 0.971 0.943 0.915 0.888 0.863 0.962 0.925 0.889 0.855 0.822 0.952 0.907 0.864 0.823 0.784 0.943 0.890 0.840 0.792 0.747 0.935 0.873 0.816 0.763 0.713 0.926 0.857 0.794 0.735 0.681 0.917 0.842 0.772 0.708 0.650 0.909 0.826 0.751 0.683 0.621 1 2 3 4 5 6 7 8 9 10 0.942 0.933 0.923 0.914 0.905 0.888 0.871 0.853 0.837 0.820 0.837 0.813 0.789 0.766 0.744 0.790 0.760 0.731 0.703 0.676 0.746 0.711 0.677 0.645 0.614 0.705 0.665 0.627 0.592 0.558 0.666 0.623 0.582 0.544 0.508 0.630 0.583 0.540 0.500 0.463 0.596 0.547 0.502 0.460 0.422 0.564 0.513 0.467 0.424 0.386 6 7 8 9 10 11 12 13 14 15 0.896 0.887 0.879 0.870 0.861 0.804 0.788 0.773 0.758 0.743 0.722 0.701 0.681 0.661 0.642 0.650 0.625 0.601 0.577 0.555 0.585 0.557 0.530 0.505 0.481 0.527 0.497 0.469 0.442 0.417 0.475 0.444 0.415 0.388 0.362 0.429 0.397 0.368 0.340 0.315 0.388 0.356 0.326 0.299 0.275 0.350 0.319 0.290 0.263 0.239 11 12 13 14 15 (n) 1 2 3 4 5 11% 0.901 0.812 0.731 0.659 0.593 12% 0.893 0.797 0.712 0.636 0.567 13% 0.885 0.783 0.693 0.613 0.543 14% 0.877 0.769 0.675 0.592 0.519 15% 0.870 0.756 0.658 0.572 0.497 16% 0.862 0.743 0.641 0.552 0.476 17% 0.855 0.731 0.624 0.534 0.456 18% 0.847 0.718 0.609 0.516 0.437 19% 0.840 0.706 0.593 0.499 0.419 20% 0.833 0.694 0.579 0.482 0.402 1 2 3 4 5 AN 6 7 8 9 10 0.535 0.482 0.434 0.391 0.352 0.507 0.452 0.404 0.361 0.322 0.480 0.425 0.376 0.333 0.295 0.456 0.400 0.351 0.308 0.270 0.432 0.376 0.327 0.284 0.247 0.410 0.354 0.305 0.263 0.227 0.390 0.333 0.285 0.243 0.208 0.370 0.314 0.266 0.225 0.191 0.352 0.296 0.249 0.209 0.176 0.335 0.279 0.233 0.194 0.162 6 7 8 9 10 11 12 13 14 15 0.317 0.286 0.258 0.232 0.209 0.287 0.257 0.229 0.205 0.183 0.261 0.231 0.204 0.181 0.160 0.237 0.208 0.182 0.160 0.140 0.215 0.187 0.163 0.141 0.123 0.195 0.168 0.145 0.125 0.108 0.178 0.152 0.130 0.111 0.095 0.162 0.137 0.116 0.099 0.084 0.148 0.124 0.104 0.088 0.074 0.135 0.112 0.093 0.078 0.065 HQ345 11 12 13 14 15 Annuity Table r Present value of an annuity of 1 i.e. 1 -(1+r)^ Where = discount rate n = number of periods Discount rate (1) Periods (n) 1% 2% 3% 4% 5% 6% 7% 8% 9% 10% 1 2 3 4 5 0.990 1.970 2.941 3.902 4.853 0.980 1.942 2.884 3.808 4.713 0.971 1.913 2.829 3.717 4.580 0.962 1.886 2.775 3.630 4.452 0.952 1.859 2.723 3.546 4.329 0.943 1.833 2.673 3.465 4.212 0.935 1.808 2.624 3.387 4.100 0.926 1.783 2.577 3.312 3.993 0.917 1.759 2.531 3.240 3.890 0.909 1.736 2.487 3.170 3.791 1 2 3 4 5 0 000 6 7 8 9 10 5.795 6.728 7.652 8.566 9.471 5.601 6.472 7.325 8.162 8.983 5.417 6.230 7.020 7.786 8.530 5.242 6.002 6.733 7.435 8.111 5.076 5.786 6.463 7.108 7.722 4.917 5.582 6.210 6.802 7.360 4.767 5.389 5.971 6.515 7.024 4.623 5.206 5.747 6.247 6.710 4.486 5.033 5.535 5.995 6.418 4.355 4.868 5.335 5.759 6.145 6 7 8 9 10 11 11 12 12 10.37 11.26 12.13 13.00 13.87 13 14 15 9.787 10.58 11.35 12.11 12.85 9.253 9.954 10.63 11.30 11.94 8.760 9.385 9.986 10.56 11.12 8.306 8.863 9.394 9.899 10.38 7.887 8.384 8.853 9.295 9.712 7.499 7.943 8.358 8.745 9.108 7.139 7.536 7.904 8.244 8.559 6.805 7.161 7.487 7.786 8.061 6.495 6.814 7.103 7.367 7.606 13 14 15 -NO (0) 1 2 3 4 5 11% 0.901 1.713 2.444 3.102 3.696 12% 0.893 1.690 2.402 3.037 3.605 13% 0.885 1.668 2.361 2.974 3.517 14% 0.877 1.647 2.322 2.914 3.433 15% 0.870 1.626 2.283 2.855 3.352 16% 0.862 1.605 2.246 2.798 3.274 17% 0.855 1.585 2.210 2.743 3.199 18% 0.847 1.566 2.174 2.690 3.127 19% 0.840 1.547 2.140 2.639 3.058 20% 0.833 1.528 2.106 2.589 2.991 1 2 3 4 5 6 7 8 9 10 4.231 4.712 5.146 5.537 5.889 4.111 4.564 4.968 5.328 5.650 3.998 4.423 4.799 5.132 5.426 3.889 4.288 4.639 4.946 5.216 3.784 4.160 4.487 4.772 5.019 3.685 4.039 4.344 4.607 4.833 3.589 3.922 4.207 4.451 4.659 3.498 3.812 4.078 4.303 4.494 3.410 3.706 3.954 4.163 4.339 3.326 3.605 3.837 4.031 4.192 6 7 8 9 10 N1 11 12 13 14 15 6.207 6.492 6.750 6.982 7.191 5.938 6.194 6.424 6.628 6.811 5.687 5.918 6.122 6.302 6.462 5.453 5.660 5.842 6.002 6.142 5.234 5.421 5.583 5.724 5.847 5.029 5.197 5.342 5.468 5.575 4.836 4.988 5.118 5.229 5.324 4.656 4.793 4.910 5.008 5.092 4.486 4.611 4.715 4.802 4.876 4.327 4.439 4.533 4.611 4.675 11 12 13 14 15 QUESTION 1 Restriction plc is reviewing investment proposals that have been submitted by divisional managers. The investment funds of the company are limited to 800,000 in the current year. Details of three possible investments, none of which can be delayed, are given below. Project 1 An investment of 300,000 in workstation assessments. Each assessment would be on an individual employee basis and would lead to savings in labour costs from increased efficiency and from reduced absenteeism due to work-related illness. Savings in labour costs from these assessments are expected to be as follows: Year Cash flows (000) 1 85 2 90 3 95 4 100 5 95 Project 2 An investment of 450,000 in individual workstations for staff that is expected to reduce administration costs by 140,800 per annum for the next five years. Project 3 An investment of 400,000 in new ticket machines. Net cash savings of 130,000 per annum are expected during the five-year life of the machines. Restriction plc has a cost of capital of 12% and taxation should be ignored. Required: a) Determine the best way for Restriction plc to invest the available funds and calculate the resultant NPV: i) on the assumption that each of the three projects are divisible; ii) on the assumption that none of the projects are divisible. You should treat i) and ii) as independent situations and your advice should clearly state the total NPV generated by your choice in both scenarios. (13 marks) b) Explain how the NPV investment appraisal method is applied in situations where capital is rationed. (4 marks) c) Discuss the reasons why capital rationing may arise. (8 marks) Total: 25 marks
Step by Step Solution
There are 3 Steps involved in it

Get step-by-step solutions from verified subject matter experts